TMA Centered Bands Indicator
Through the use of bands, the TMA Centered Bands Indicator illustrates the broad direction of the trend.
- Description
- Indicator Settings
Description
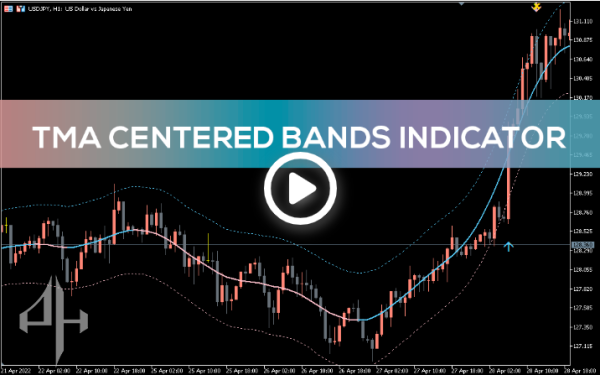
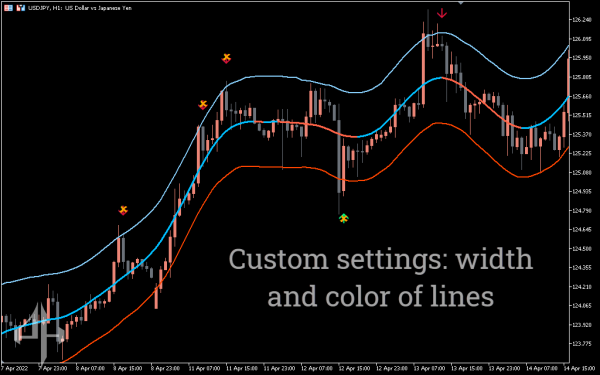
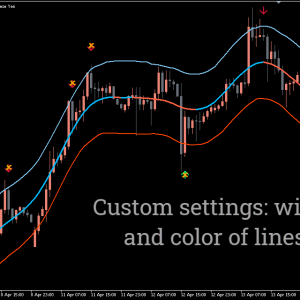
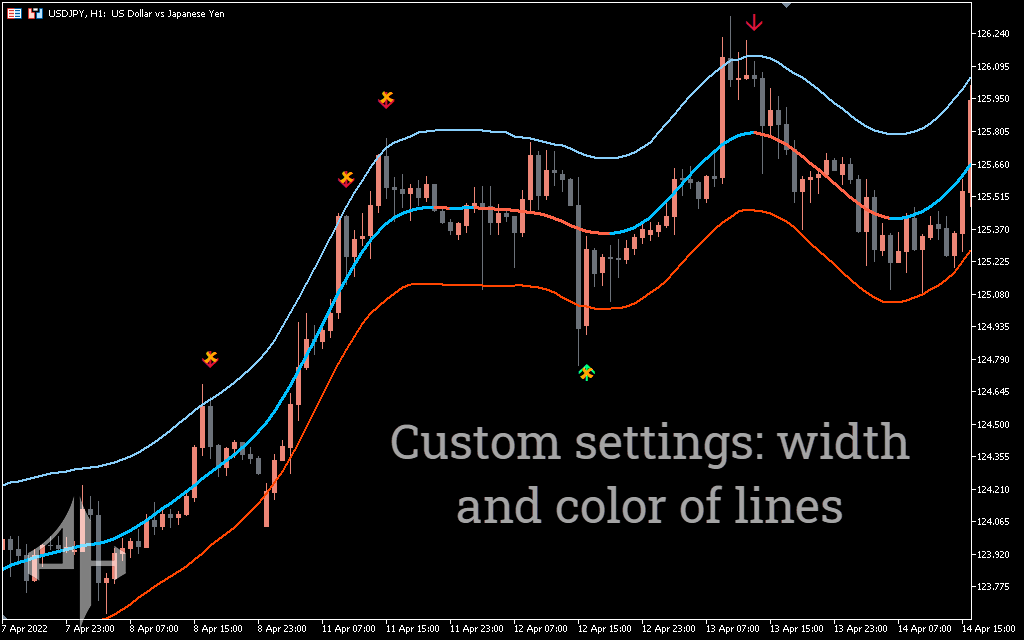
The total price trend is displayed on the chart by the TMA Centered Bands indicator for MT5. Three pink, light-blue, and pink-light-blue stripes are visible.
The middle stripe shifts from pink to light blue, while the top and bottom stripes are depicted in pink and light blue, respectively. Each band has an MA period and is composed of moving averages. Since the indicator displays triangular bands, the term TMA is derived from triangular moving averages.
Every time the trend shifts, the price will move between these bands, establishing entry and exit points.
How to trade with the TMA Centered Bands indicator
The TMA Centered Bands indicator creates bands on the chart based on the moving average’s strength.
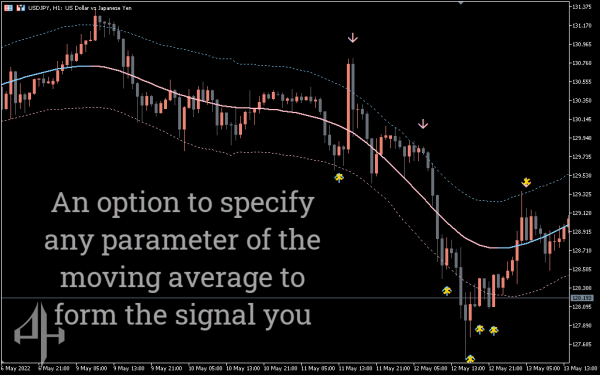
Every band serves a distinct purpose. For instance, there is a possibility that the price will revert if it rises above the upper band. In the same way, a reversal may occur if the price falls below the bottom band. Depending on the trend’s direction, the middle band changes color from light-blue to pink.
You can short when the price breaks over the upper band. However, when the price drops below the bottom band, you can start long bets. Between the top and lower bands, the middle band serves as a mediator. Every time a trend veers off course, it becomes light-blue or pink. An upswing is shown by light-blue, and a decline by pink.
TMA Centered Bands – Buy Strategy
-
Price Position: Wait for the price to move below the lower TMA band.
-
Trend Confirmation: Allow the price to continue its downward movement briefly to confirm momentum.
-
Entry Point: Enter a long (buy) position when the price touches or approaches the lower band.
-
Stop-Loss Placement: Set a stop-loss slightly below the recent swing low or entry point.
-
Exit Signal: Close the trade when the middle TMA band changes color to pink, indicating a potential shift in trend.
TMA Centered Bands – Sell Strategy
-
Price Position: Wait for the price to move above the upper TMA band.
-
Trend Confirmation: Allow the price to continue rising briefly to confirm the upward movement.
-
Entry Point: Enter a short (sell) position when the price touches or nears the upper band.
-
Stop-Loss Placement: Set a stop-loss just above the recent high or entry level.
-
Exit Signal: Close the trade when the middle TMA band changes to light blue, signaling a potential trend reversal.
Conclusion
You may use the TMA Centered Bands indicator in any trading strategy because it operates on any time frame. Furthermore, the indicator provides you with a broad overview of the trend’s direction. There is a chance of losing with the indication because there is no Holy Grail system. For further trend confirmation, you can also pair the TMA Centered Bands indicator with confirmation indicators like RSI or moving averages.
Centered TMA Indicator Settings
-
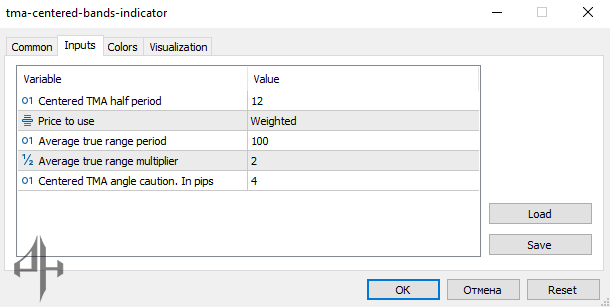
Centered TMA Half Period: Default is 12. This represents half the length of the moving average used in the calculation.
-
Price to Use: Refers to the price input used to determine the current trend (e.g., close, open, high, low).
-
ATR Period: Default is 100. This is the period used to calculate the Average True Range, which measures market volatility.
-
Multiplier: Default is 2.0. This value scales the ATR, effectively adjusting the spacing between the upper and lower bands.
-
Centered TMA Angle Caution (in pips): Defines the angle threshold (measured in pips) at which the indicator begins to display caution signals.

