- Description
- Indicator Settings
Description
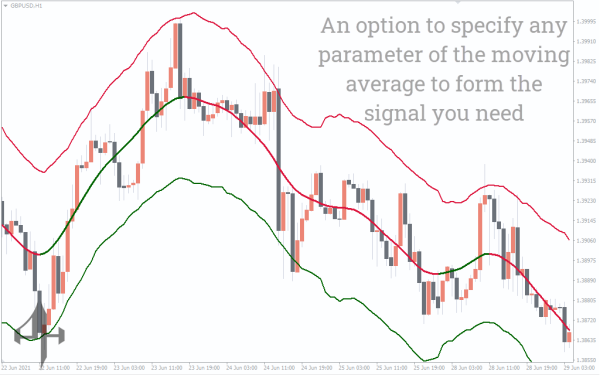
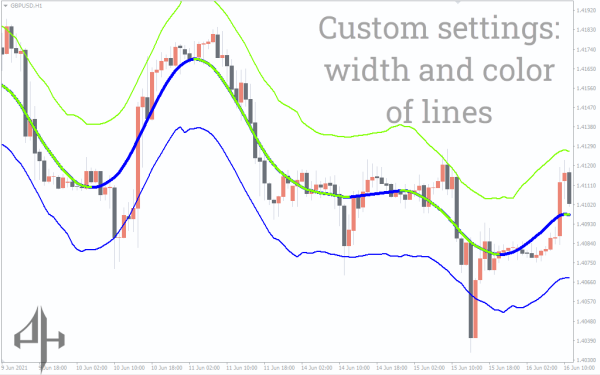
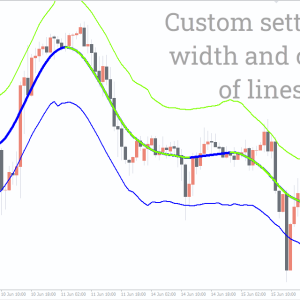
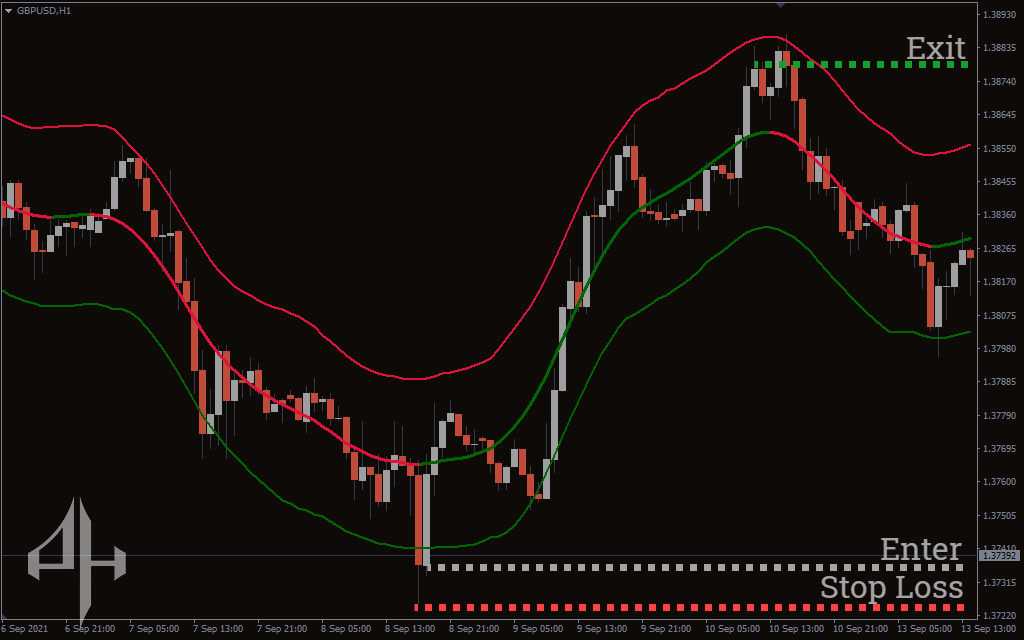
By drawing bands on the chart, the TMA Centered Bands Indicator for MT4 lets you know the general direction of the price. Three bands of the colors red, green, and red-green are plotted.
Red is used in the top bands, red is used in the lower bands, and red-green is used in the middle bands.
All of the bands have an MA period and are composed of moving averages. Triangular moving averages are the source of the term TMA because the indicator displays triangular bands.
When a trend changes direction, the price will move between these bands, creating entry and exit points.
How to trade the TMA Centered Bands Indicator
The TMA Centered Bands Indicator plots bands on the chart by leveraging the strength of the moving average.
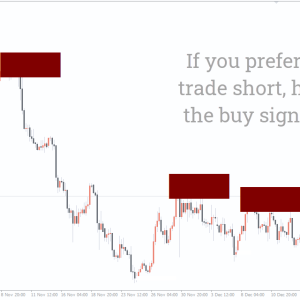
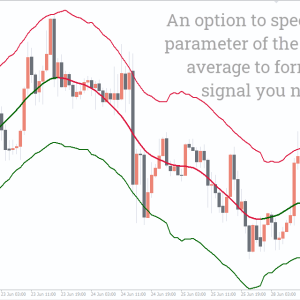
Every band serves a distinct purpose. For instance, there is a probability that the price will reverse after it crosses the top band. Likewise, a reversal may occur if the price falls below the bottom band. Depending on the trend’s direction, the middle band changes color from green to red.
You can enter short positions when the price crosses the top band. However, if the price moves below the bottom band, you can enter long bets.
Between the upper and lower bands, the middle band acts as a mediator. A trend turns red or green whenever it veers off course. Red indicates a downtrend, and green indicates an uptrend.
TMA Centered Bands Indicator Buy Strategy
-
Wait for the price to drop below the lower band.
-
Allow the price trend to proceed in the same direction.
-
Open a long position at the lower band.
-
Set the stop-loss just below the entry point’s low.
-
Close the trade when the middle band turns red.
TMA Centered Bands Indicator Sell Strategy
-
Wait for the price to rise above the upper band.
-
Allow the price trend to continue in that direction.
-
Enter a short position at the upper band.
-
Set the stop-loss just above the entry point’s high.
-
As soon as the centered band turns green, exit the trade.
Conclusion
You can use the TMA Centered Bands Indicator with any trading strategy because it is applicable to all timeframes. Furthermore, the indicator gives you a broad overview of the trend’s direction.
There is a chance of loss with the indication because there is no holy-grail system.
To further validate the trend, you can also pair it with confirmation indicators like the RSI or moving averages.
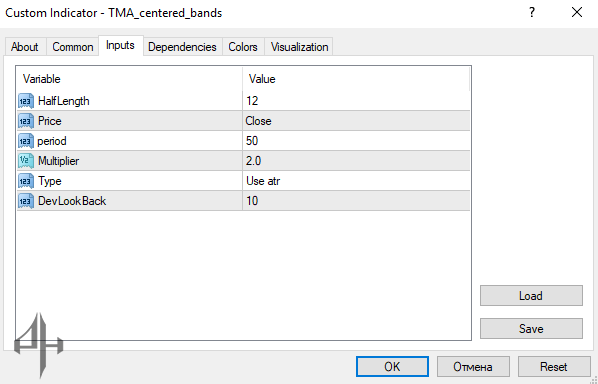
HalfLength: The default is 12. It represents half the length of the moving average.
Price: Close. Refers to the current price of the trend.
Period: Default value is 50. This is the moving average period.
Multiplier: Default value is 2.0. It doubles the period to decrease the gap between the bands.
Type: Use ATR. Represents the Average True Range model.
DevLookBack: 10 is the default value.