
- Description
- Reviews (0)
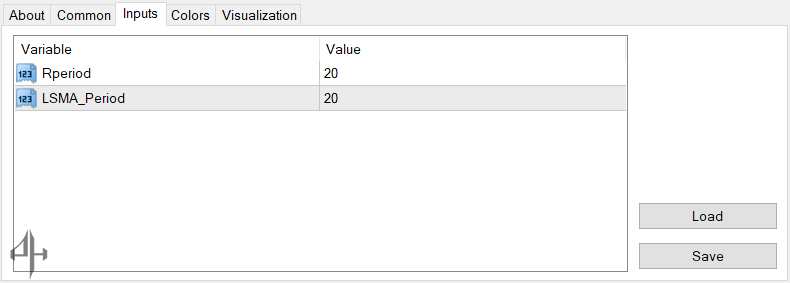
- Indicator Settings
Description
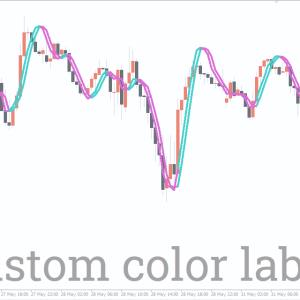
For the MT4 platform, the Trendline is an auto Trendline Indicator MT4. Straight trend lines are not drawn by it. Rather, it employs the Least Square Moving Average (LSMA) to identify the price’s dynamic trend lines. The Trendline indicator’s primary function is to identify the appropriate market trend. Additionally, it displays the market’s dynamic support and resistance in real time. It can therefore be used to determine possible upcoming entry levels within the appropriate trend direction.
Additionally, the Trendline indicator aids in identifying price action patterns and determining the likelihood that a trade setting will be successful. For instance, there is a greater chance of profiting from a price breakout or bullish pin bar that follows the existing trend than by going against it.
Additionally, you can use the Trendline Indicator MT4 to help your Expert Advisor (EA) perform better. Once the price reaches genuine support or resistance in the trendline area, you can instruct your EA to initiate an entry.
Drawing a fractal-based trend line is not supported by the Trendline, which is a non-repaint MA-based indicator. Trendline Indicator MT4 is ideal for stock, futures, and cryptocurrency chart analysis in addition to FX instruments.
How to trade within the trend using the Trendline Indicator MT4?
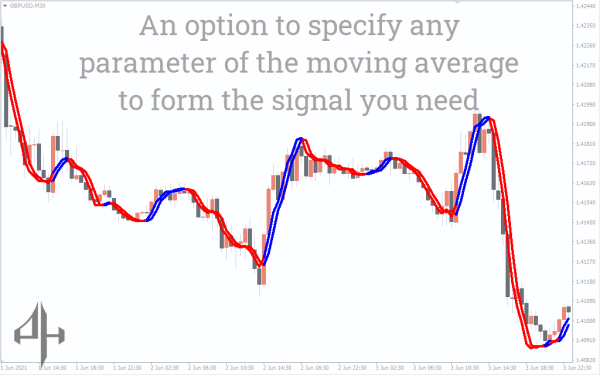
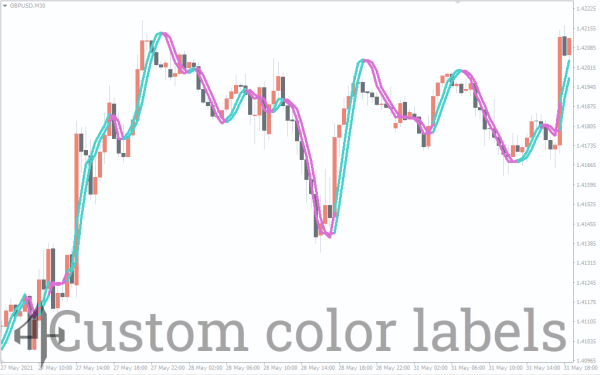
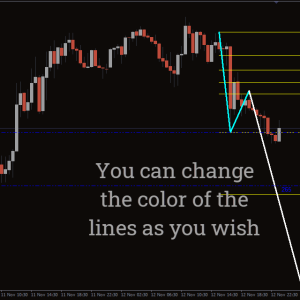
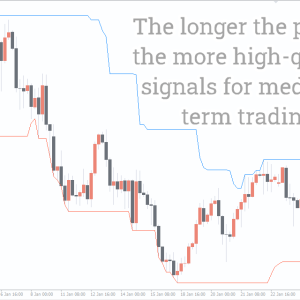
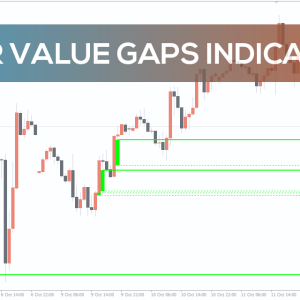
The dynamic trendline of Trendline Indicator MT4 is plotted using two lines. To indicate shifts in the market trend directions, it alternates between the colors blue and red. When the trend is bullish, the indicator is blue; when the trend shifts to a bearish phase, it turns red.
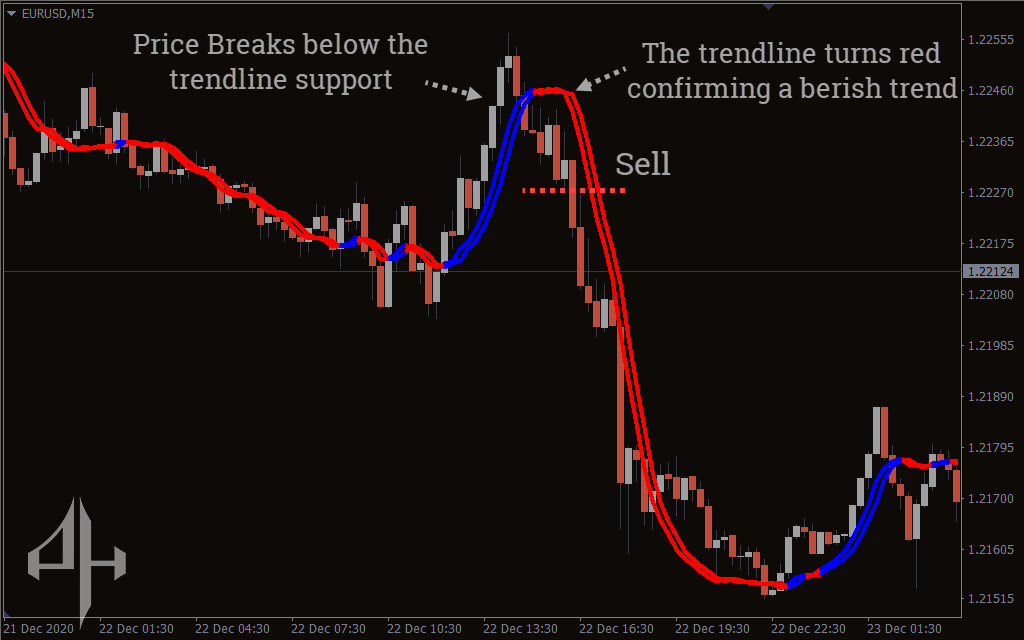
You must first ascertain the current trend status in order to trade. After that, watch for price action signals close to the trendline level that confirms the direction of the current trend. As an alternative, you may set up an MT4 alert close to the trendline region to receive notifications anytime the price approaches it.
The trend line support at the top of the chart was broken by the price in the example above. The market’s negative tendency was later confirmed when the trend line turned red. Furthermore, the price was unable to move back above the trend line support. It is the perfect position for a sell entry, according to the trendline trading technique.
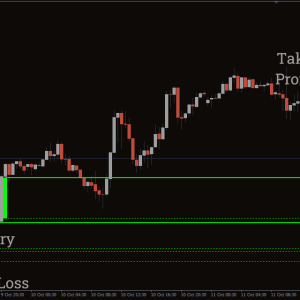
Additionally, to identify trend-following market entrances, you can utilize additional candlestick or chart patterns such false breaks, price breakouts, and triangle patterns. When using the Trendline indicator for trading, you must adhere to two rules:
Plotting the price action signal close to the present trend line level is necessary.
- The market trend and the price action signal need to go in the same direction.
- For instance, the price rises above the trendline level after making a false break at the dynamic support.
Now, it might be the best time to place a purchase order if the indicator is blue, indicating a bullish trend. However, if the market trend is bullish, it might not be a good idea to short after a negative price breakout.
Conclusion
An effective MT4 indicator for examining the market trend and the price’s support and resistance is the Trendline Indicator MT4. It is ideal for trading stocks, futures, and other online trading assets, but it performs best when used on a forex currency chart.
Be the first to review “Trendline Indicator MT4, Master Market Moves Fast”
-
Rperiod: Specifies the number of price bars used by the indicator to calculate the trendline level.
-
LSMA_period: Sets the period for the Least Squares Moving Average, helping to identify the market trend.

Reviews
There are no reviews yet.