
- Description
- Reviews (0)
- Indicator Settings
Description
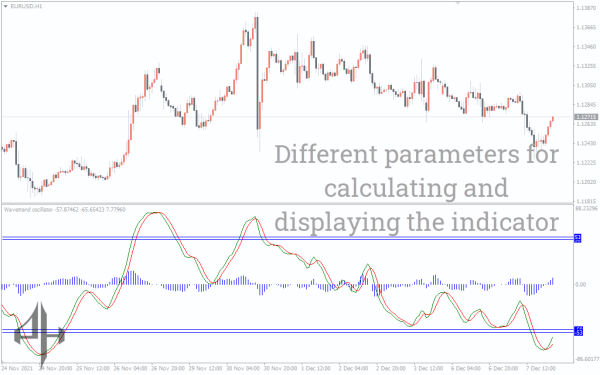
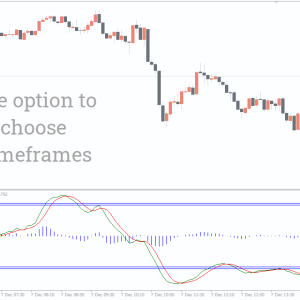
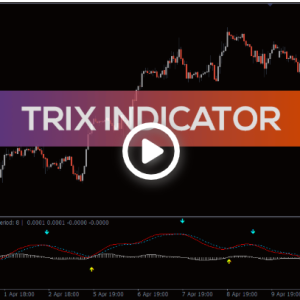
One forex technical indicator designed to track market trends is the Wave Trend Oscillator indicator for MetaTrader. As the price fluctuates between the chart’s various levels, it oscillates.
The indicator keeps an eye on the price’s waning momentum in anticipation of a possible trend reversal. It has a smoothing effect built in, which makes it susceptible to oscillator crossovers and price fluctuations.
Additionally, the indicator includes exhaustion terminals, sometimes referred to as the overbought and oversold levels, where a price reversal is most likely to occur. As the price gets closer to specific levels, this aids in your ability to predict trade setup.
For swing, day, and scalping trading, the Wave Trend Oscillator indicator is appropriate. Additionally, by offering a tradable point of market interest, it would be beneficial to both inexperienced and seasoned traders.
Additionally, the indicator is effective in detecting divergence for trading divergence setups. The indicator’s placement on a different window from the main chart makes this possible.
BUY/SELL Signals from Wave Trend Oscillator Indicator
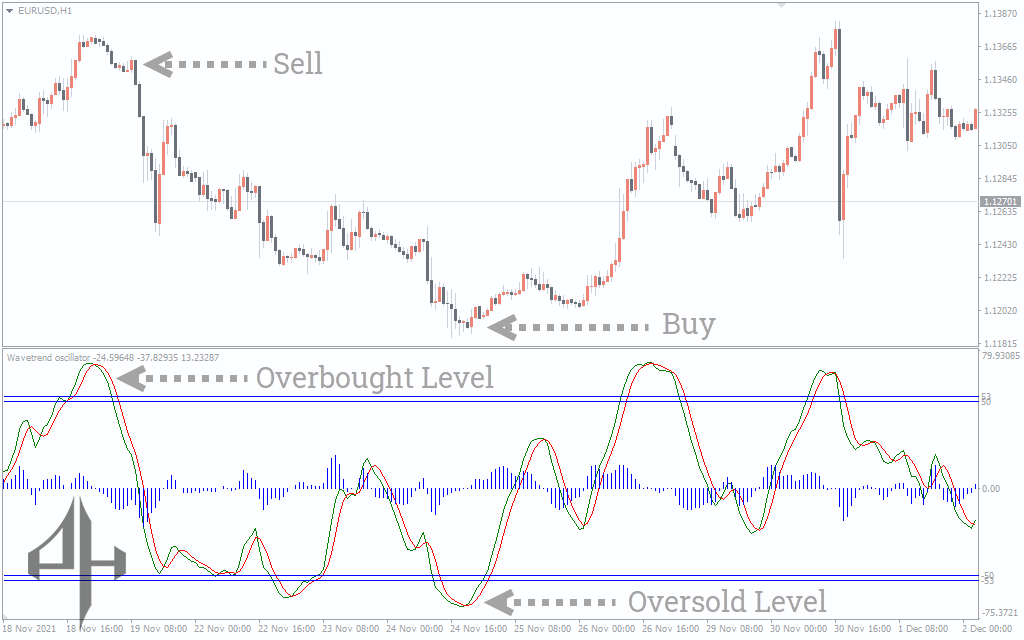
The Wave Trend Oscillator indicator is displayed on a EUR/USD chart in the image above. To measure market extremes, the indicator features two terminals: overbought and oversold.
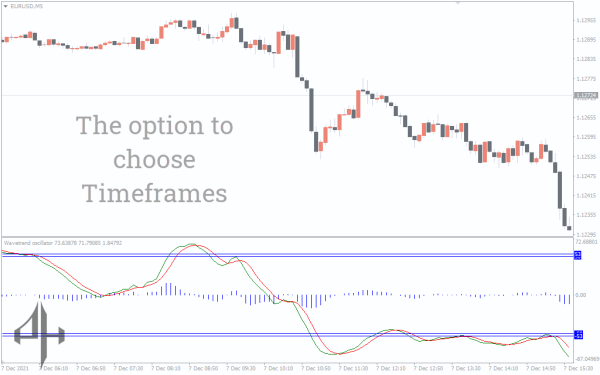
When the oscillator crosses, the Wave Trend Oscillator indicator for MT4 provides BUY/SELL trading signals. Higher time frames yield more dependable signals from the indicator, particularly when the price reaches the overbought/oversold level.
In any case, as no indicator is 100% accurate, not all crosses can be traded. Therefore, it is advised to use this MT4 indication in conjunction with other indicators or price action. Instead of increasing your losses, this helps you raise your winning rates.
The oscillator must make contact with the indicator’s oversold area in order to produce a high probability BUY setup. When the price prints a SELL reversal candlestick pattern and the oscillator crosses the oversold level, you can open a BUY/LONG position.
Following the formation of the bullish engulfing candlestick on the oversold terminal, the BUY example above becomes legitimate. Before reversing course, the trade instantly handed out large pips to the upside.
The similar idea was used in the SELL setup mentioned above. Following the formation of the bearish engulfing candlestick pattern at the overbought terminal, the SELL becomes valid.
Being a successful trader requires knowing both take-profit and stop-loss strategies. Make sure they are realistic and positioned strategically.
Conclusion
You can increase your success rates by placing trades at crucial turning times with the Wave Trend Oscillator indicator for MT4. To improve your trading experience, you must include this indicator on your chart. Lastly, you can download it for free.
Be the first to review “Wave Trend Oscillator Indicator”
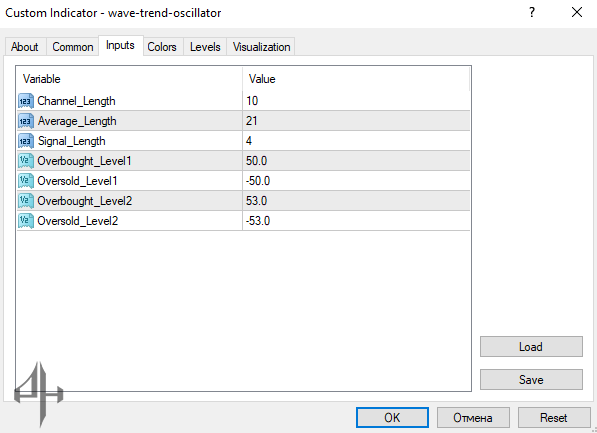
Channel_Length: Specifies the value used to calculate the channel’s length.
Average_Length: Determines the average length of the signal.
Signal_Length: Indicates the length of the indicator’s signal.
Overbought_Level1: Defines the first overbought threshold.
Oversold_Level1: Defines the first oversold threshold.
Overbought_Level2: Specifies the value for the second overbought threshold.
Oversold_Level2: Specifies the value for the second oversold threshold.
Reviews
There are no reviews yet.