- Description
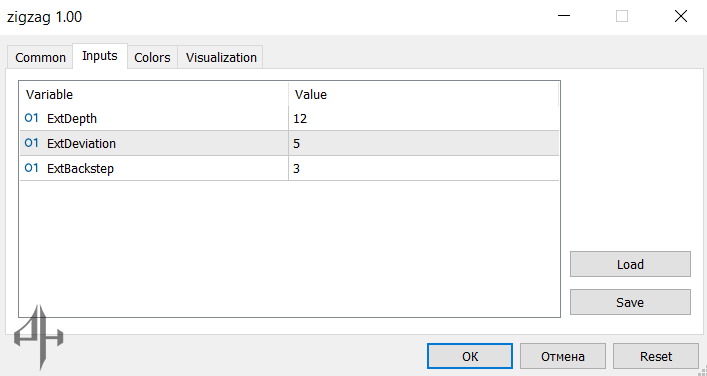
- Indicator Settings
Description
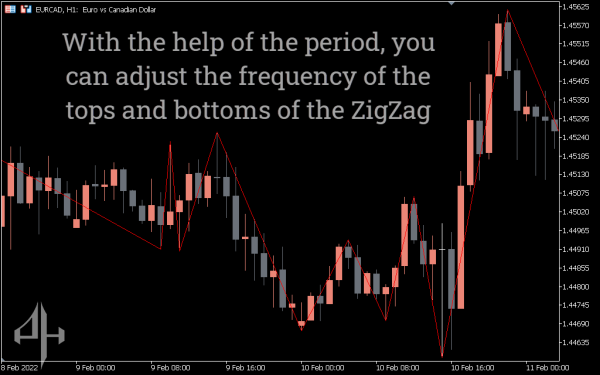
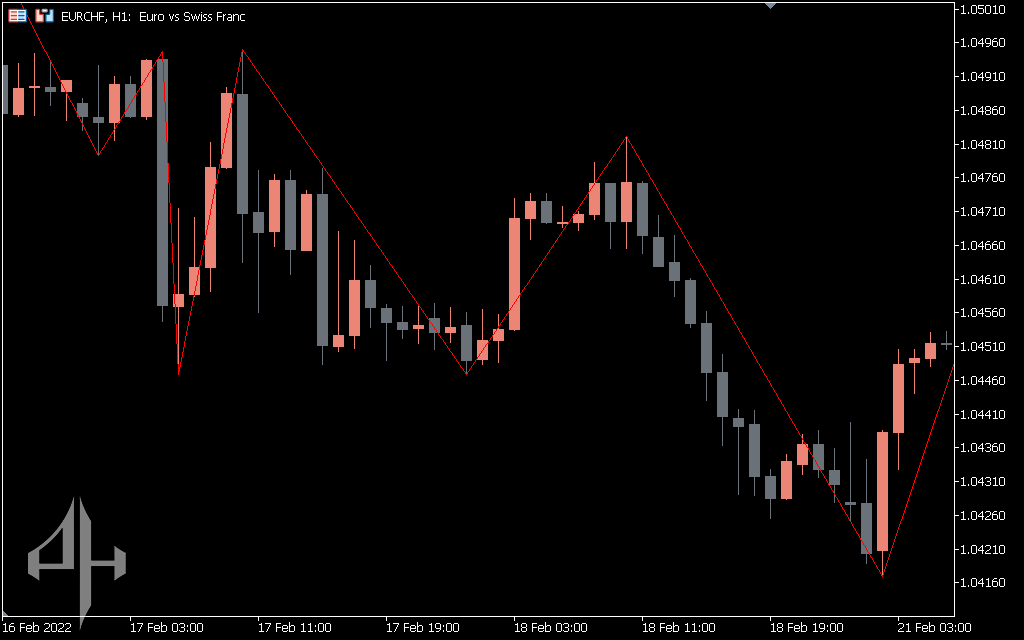
There is no straight line movement in the currency market. The price movement generates ups and downs, peaks and troughs that resemble wave-like patterns, even though the price may follow a dominating trend (for instance, an uptrend). As a result, figuring out the price movement is difficult. The ZigZag indicator is useful in this situation.
The market’s noise is eliminated by the zigzag indicator. To put it another way, it provides you with a clear image of the real price movement from one point to another. As a result, it aids traders in visualizing the peaks and valleys of a particular trading session. The zigzag indicator gets its name because it makes use of the closing price.
Finding appropriate entry points is made easier with the help of the indicator, particularly during times of extreme volatility. It is a great indicator for tracking Fibonacci levels and Elliot waves. The nice thing is that the Zigzag indicator can be applied to any currency pair and time frame.
How to Use the ZigZag Indicator
The Metatrader 5 zigzag indicator is essentially a background tool. Compared to other indicators, it is less interactive. In other words, instead of calculating or offering ideal entry points, it offers broad market knowledge on the price movement. It is an underappreciated technical analysis indication that is frequently employed as a supplemental tool.
How is the indication used now? You must specify the starting point and endpoint if you are utilizing the indicator during a certain session. Setting the endpoint for active sessions is not required, though.
It tracks market trends while disregarding minor declines. As a result, it can greatly aid in the identification of chart patterns such as head and shoulder and double touch. The zigzag case indicator is a repaint indicator, so take note of that. This indicates that when a new high or low is reached, the indicator repaints.
Signals to Buy and Sell
The zigzag indicator for MT5 is a really special indicator. There is an inherent bullish or bearish signal in it. In essence, it serves as a verification tool for harmonic pattern recognition and Elliott wave counting. Therefore, you should use it to support your trading strategy by using it to confirm appropriate buy and sell positions.
An Example of Trading
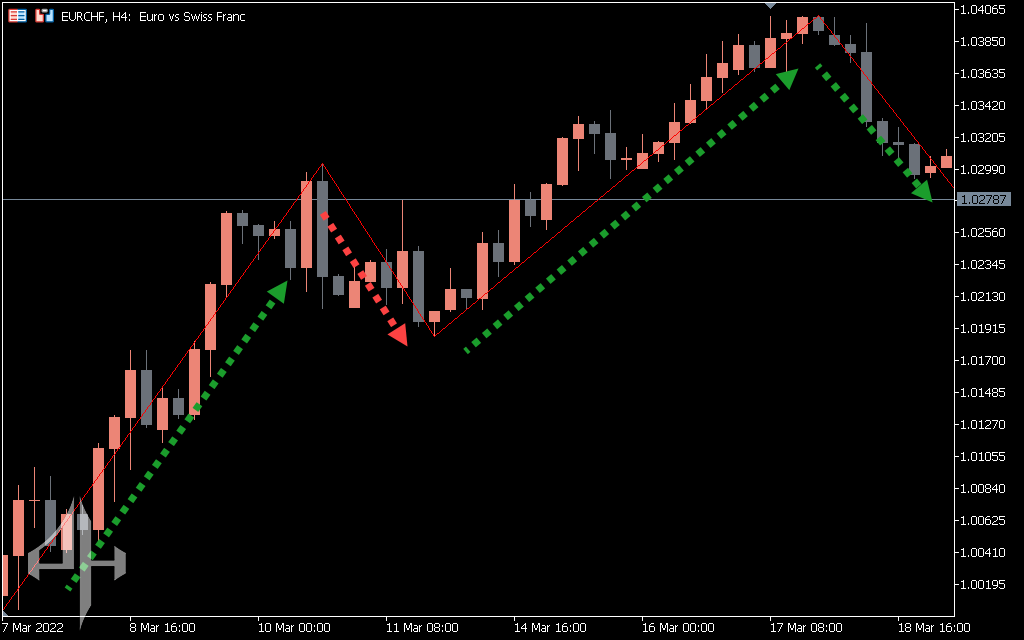
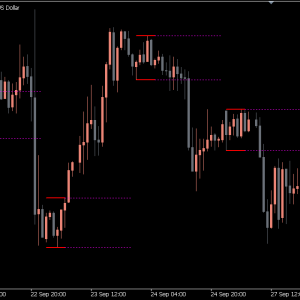
The EUR/CHF price movement on the H4 (four-hour) timeframe is displayed in the following chart with the default values of 12, 5, 3. A new low is established after the first significant high. Prior to forming a double bottom chart pattern, the price retraces and makes a lower high. A double bottom is a terrific purchase indication, so keep that in mind. In general, the indicator removes market noise so that we can easily detect the positive price pattern.
Conclusion
The Zigzag indicator should not be used alone. For example, you may make an overlapping confluence signal by combining the swing level of the indicator with the Fibonacci level. Additionally, the market will create minimum retracements during periods of strong momentum. As a result, you ought to modify the configuration to conform to the current market conditions.
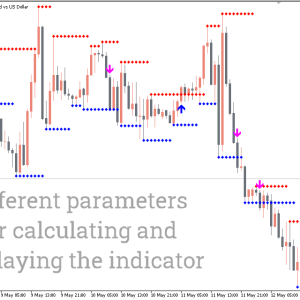
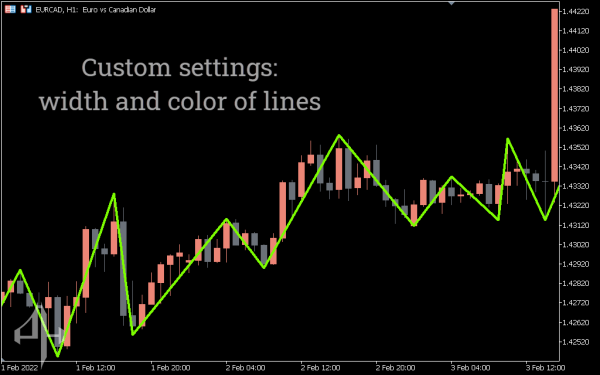
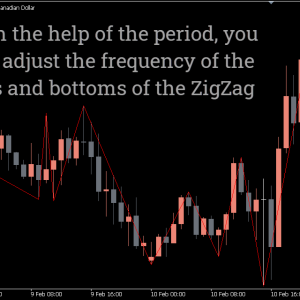
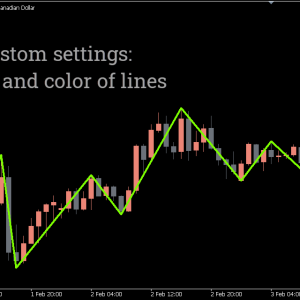
You can adjust the settings to fit the state of the market and improve your trading technique with the help of the indicators. By changing its specifications to fit the current state of the market, you can modify the indicator.
-
ExtDepth: Minimum number of bars required between the minimum and maximum points.
-
ExtDeviation: Number of points allowed after forming the minimum or maximum.
-
ExtBackstep: Number of bars between the high and low points.