

- Description
- Indicator Settings
Description
You should be able to recognize important swing levels if the foundation of your Forex trading technique is price action and market flow principles. The ZigZag NK Arrows indicator is useful for identifying pivot points and swing lows and highs, which are crucial points that influence price movement.
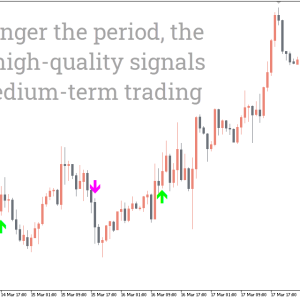
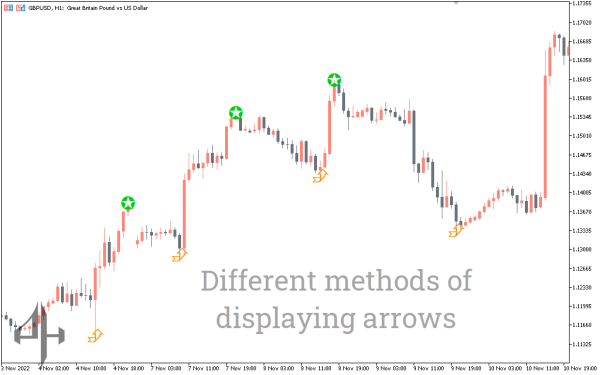
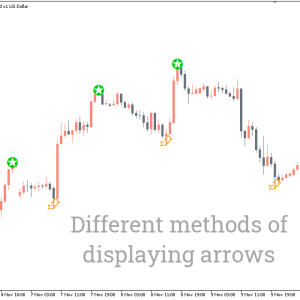
The standard zigzag indicator and the zigzag arrow are extremely similar. This aids traders in recognising swing highs and lows with objectivity. However, as the name implies, the ZigZag NK Arrows Indicator displays arrows, in contrast to the standard ZigZag NK Arrows Indicator, which joins swing highs and swing lows to create a zigzag downtrend pattern. The swing highs are indicated by the red down arrow, while the swing lows are indicated by the blue up arrow.
As a result, even novice traders can use it with ease. Additionally, you can trade any currency pair using the indicator on any timeframe.
Finding Uptrends and Downtrends with the ZigZag NK Arrows Indicator
Let’s go on to the exciting phase. How can I utilize ZigZag NK Arrows Indicator to trade profitably? A market with rising highs and swinging lows is considered to be in an uptrend according to a price action method. The swing low is higher than the swing high, while the swing high is higher than the swing low.
A downtrend occurs when swing highs and lows are lower than before.
After identifying these factors, you can employ additional techniques and resources to ascertain the best time to enter the market. You may, for instance, wait for the price to reach a swing high or develop a bearish price pattern. To create a confluence and enter the market at the ideal moment, it is also prudent to wait for a bullish signal at the swing low.
Buy Signal: Wait for the indicator to display a blue arrow and enter the trade at the close of the candle. Set a stop loss just above the candle.
Sell Signal: Wait for the indicator to show a magenta arrow and enter the trade at the close of the candle. Set a stop loss just below the open of the candle.
An Example Chart

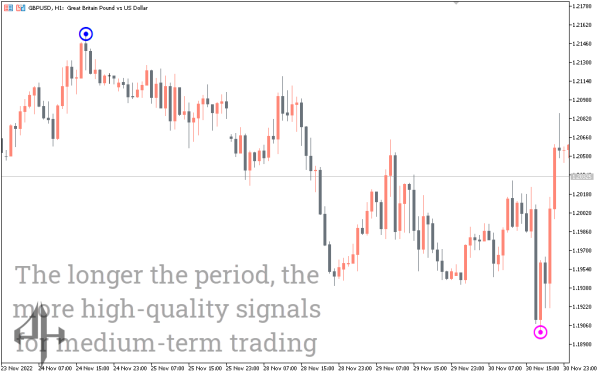
The price movement of the British pound sterling in relation to the Australian dollar is displayed in the above chart. A downtrend is indicated when the swing high, denoted by the Magenta arrow, occurs lower than the preceding swing high. A lower swing low follows the swing low shown by the blue arrow. This clearly indicates a downward tendency. A stop loss might be set a few pip’s above or below the swing high or low.
Conclusion
Swing highs and lows can be objectively determined with the aid of the ZigZag NK Arrows Indicator. The best timing to enter the trade can then be ascertained using other technical tools and tactics. Avoiding closing deals because of small pullbacks is the main goal. One indicator that you will undoubtedly require is this one.
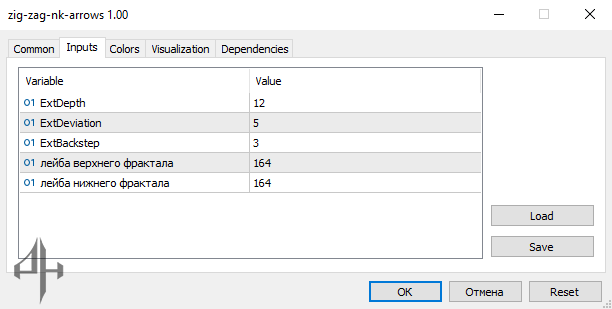
ExtDepth: Defines the number of bars used by the indicator to determine the highs and lows.
ExtDeviation: Specifies the percentage price change required for the trendline to shift from positive to negative.
ExtBackstep: Sets the minimum number of bars that can be plotted between swing highs and swing lows.
Higher Fractal Label: Represents the number of labels for higher fractals.
Lower Fractal Label: Represents the number of labels for lower fractals.