
- Description
- Reviews (0)
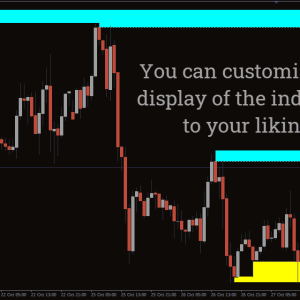
- Indicator Settings
Description
One forex trading tool that automatically draws levels of strong support or resistance on the chart is the Zone indicator for MetaTrader. Forex traders that use trend traders and support and resistance techniques might find the indicator useful.
The Zone indicator draws out zones that have a high likelihood of being respected by price and performs all technical analysis. This allows you to predict price movements as it gets closer to such a zone and make well-informed trading projections fast.
Novice traders who are still learning how to draw pertinent crucial levels might benefit from the indicator. Professional traders are also not excluded because the indicator eliminates the headache of needing to draw a support or resistance level on a regular basis.
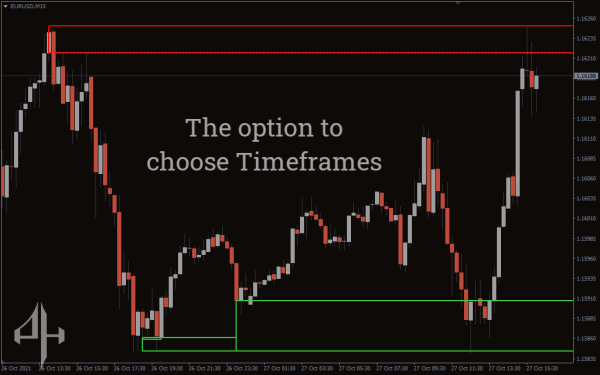
It is easy to integrate this MT4 indicator into swing, day/intraday, and scalping trading. Additionally, it functions across all time frames. For greater accuracy, it is advised to use it on longer time frames.
Zone Indicator Signals to Buy or Sell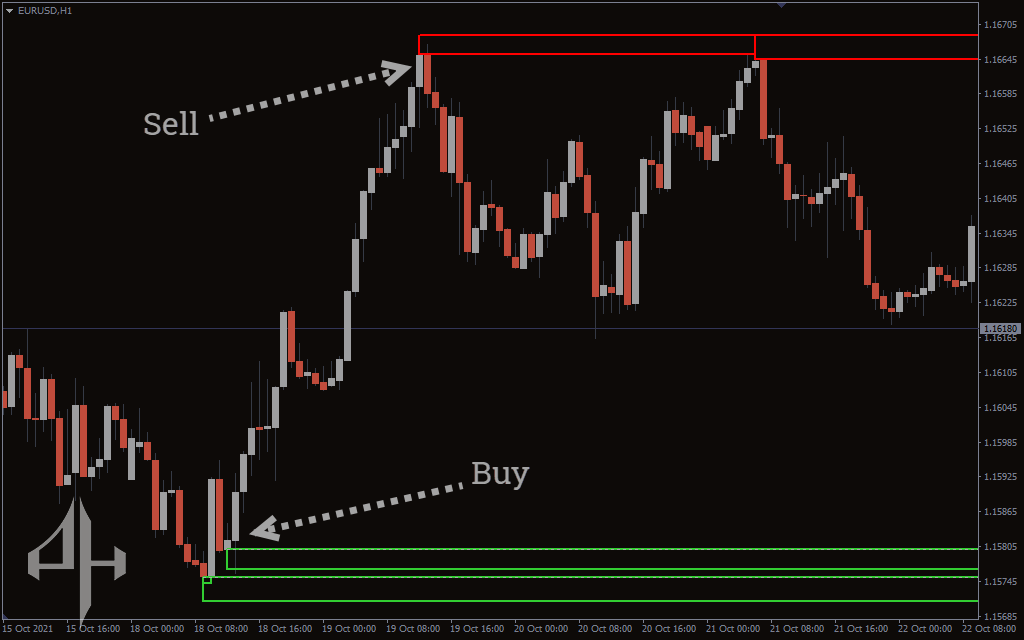
First, you can trade the forex market using the Zone indicator for MT4 as a stand-alone indicator. However, when combined with price action for trade entrances and exits, it can be more potent.
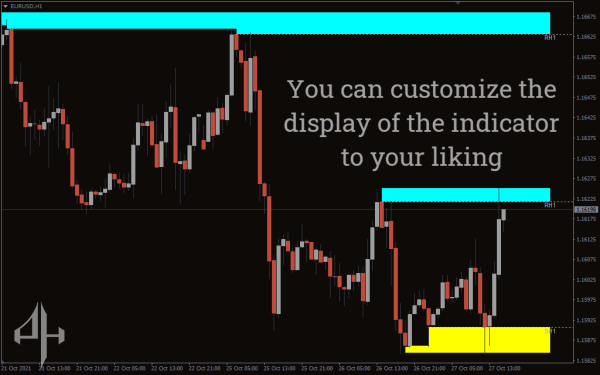
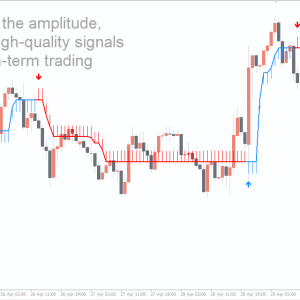
The Zone indicator’s appearance on a forex chart is depicted in the above chart. A possible support zone is indicated by the indicator drawing a GREEN horizontal bar. Additionally, a RED bar indicates possible resistance levels. For BUY/SELL entrances and exits, these signal bars are utilized.
Regarding a BUY configuration
First, watch for a possible critical market level that could serve as support to be painted by the Zone indicator. Second, when the price returned to that support level, displayed a bullish candlestick at the close, and shown rejection (wick), enter a BUY/LONG transaction.
Regarding a SELL configuration
Await the possible resistance level to be plotted on your chart by the indicator. Following a price retracement back to the resistance level, rejection indicators (wick), and a bearish candle closing, take a SELL/SHORT position. For further information on trade entries, see the image above.
Keep in mind that before making a trade, it is imperative to watch for a sign of candlestick rejection. Getting more confirmation is beneficial. It also gives you greater assurance that the price will remain at this level for some time and that the trend will reverse.
Conclusion
One essential trading indication for your forex chart is the Zone indicator for MT4. It might have a favorable effect on your trading. However, as the indicator is not a holy grail, not all signals can be traded. Lastly, there is no cost to download the indicator.
Be the first to review “Zone Indicator, Unleash Unmatched Market Clarity”
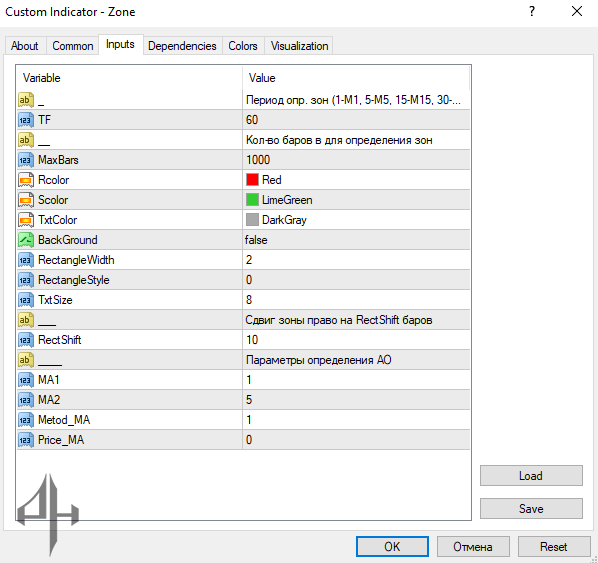
TF: Specifies the timeframe value.
MaxBars: Defines the maximum number of bars to display.
Rcolor: Sets the color of the resistance zone rectangle.
Scolor: Sets the color of the support zone rectangle.
TxtColor: Determines the color used for displaying text.
BackGround: Enables or disables the background display.
RectangleWidth: Defines the thickness of the rectangles.
TxtSize: Specifies the size of the text.
RectShift: Adjusts the horizontal offset of the rectangles.
MA1: Displays the value of the first moving average.
MA2: Displays the value of the second moving average.
Metod_MA: Sets the method used for calculating the moving average.
Price_MA: Sets the price type used for moving average calculation.
Reviews
There are no reviews yet.