
- Description
- Reviews (0)
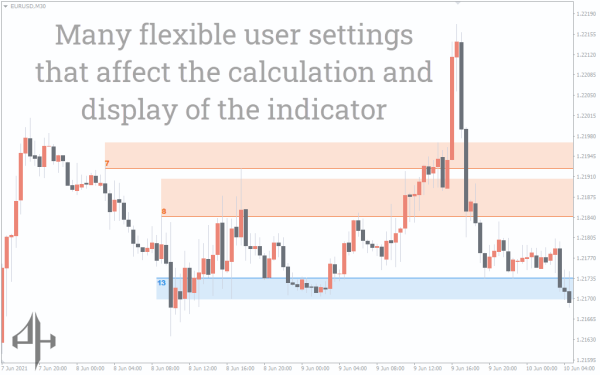
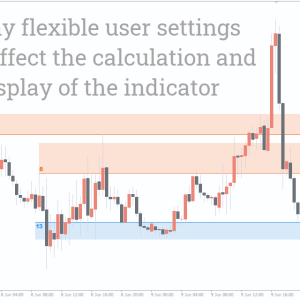
- Indicator Settings
Description
Oddly, the MT4 terminal does not by default have an indicator that would automatically construct levels of support and resistance. These levels are, after all, among the essential components of technical analysis that many traders employ. This issue is resolved by the Auto Support & Resistance Zones Indicator.
Auto Support & Resistance Zones Indicator description
Important support and resistance levels are automatically plotted on the chart by the Auto Support & Resistance Zones Indicator.
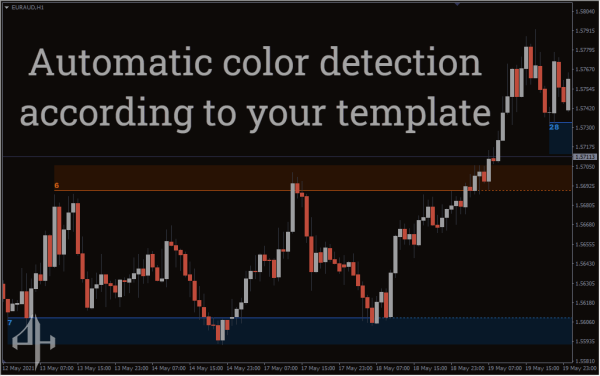
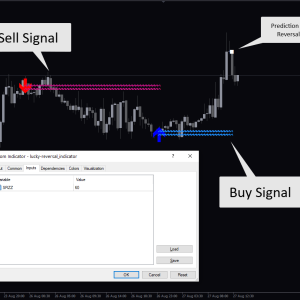
The chart displays support levels (zones) in blue and resistance levels (zones) in red. Support levels show potential buyers’ interest as the price gets closer to them.
On the other, resistance levels suggest that if the price gets close to them, sellers may become interested.
You can save time and effort when analyzing the chart because the indicator automatically draws the exact levels of support and resistance. This will undoubtedly be a huge benefit for traders of all skill levels.
Drawing levels by hand is advised for novices, though. This will improve knowledge and experience with currency market pricing. The automatically generated levels will be regarded as examples and a sort of help when the support and resistance levels are manually drawn.
When closing positions (stop-loss and take-profit), the indicator’s support and resistance levels might serve as a guidance for placing orders. They also assist in identifying the cues to start the transactions.
Auto Support & Resistance Zones Indicator drawing technique
Typically, market extrema, also known as fractals, are used to draw levels of support and resistance. The Fractals indicator is part of the MT4 terminal’s standard set of indicators. It exhibits these extremes.
The Fractals indication is already part of the Support and Resistance indicator. The spots with the highest number of fractals are used to plot the levels of Auto Support & Resistance Zones Indicator.
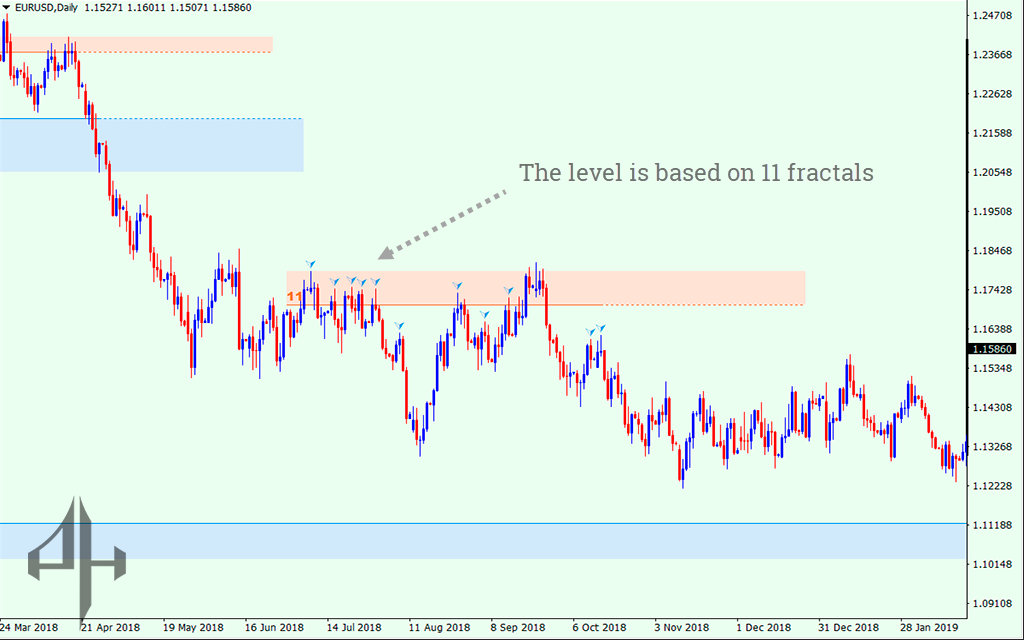
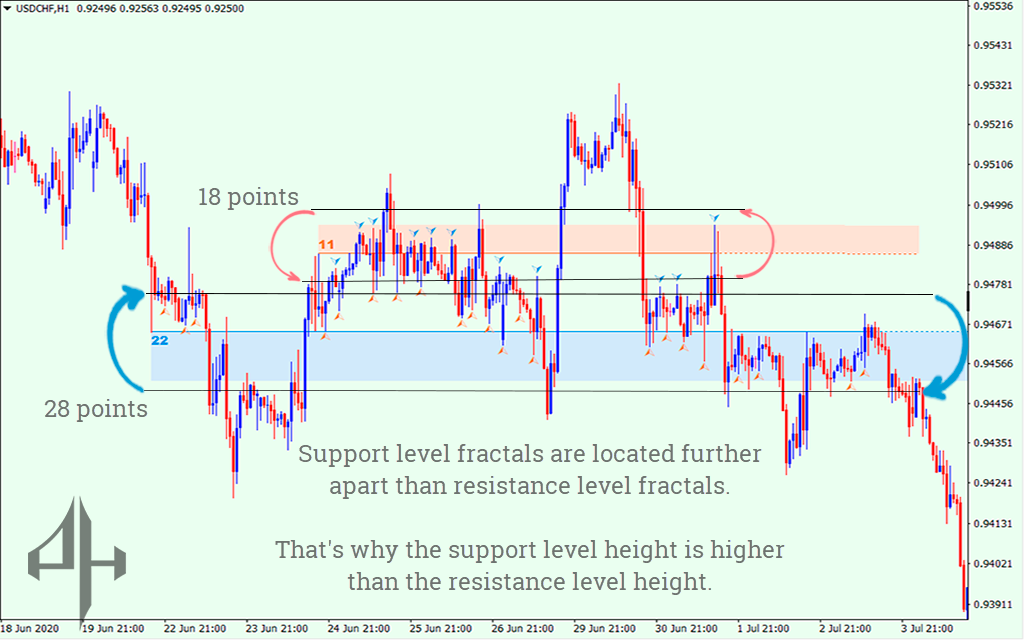
In this instance, the resistance level is constructed using eleven fractals. By clicking on the number at the start of the resistance level, you can see which fractals it was constructed with.
The distance between the fractals determines the height of the resistance and support levels.
The height of the plotted level will increase with the separation between the top and lower fractals of the support/resistance level.
The inverse is also true: the level’s height will decrease as its top and lower fractals get closer to one another.
As a result, as new fractals emerge, the indicator modifies the height of the levels rather than drawing again.
How to trade using the Auto Support & Resistance Zones Indicator
Support and resistance zone-based trading strategies are frequently depicted as indicators of a breakout or recovery from the levels. The trading details of these strategies change for trend and flat, though.
Generally speaking, one of the simplest and most successful trading methods is to go from a flat’s lower to its upper limit and vice versa.
However, it’s critical to recognize that the flat is a transient occurrence in the foreign exchange market. The flat will eventually give way to a trend.
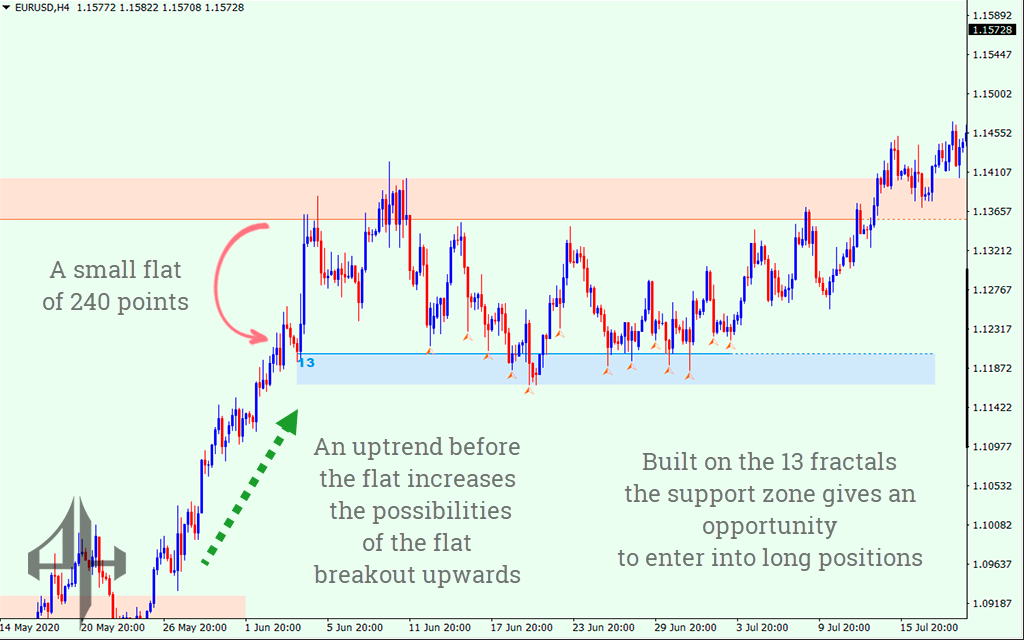
In this instance, the support and resistance zones combine to create a little flat.
The technical analysis indicates that the direction in which the trend was orientated prior to the flat has a greater chance of breaking through the flat. As a result, we believe that the likelihood of the resistance zone breaking up is more likely than a downward trend.
This makes it possible to take into account buy trades from the support zone throughout the trading day. It also permits taking into account trades for a mid- to long-term bullish breakthrough of the flat.
The Auto Support & Resistance Zones Indicator serve as levels during the active trend period. Profitable deals in the direction of the primary trend can be made from these levels.
The likelihood of a successful transaction is first increased by the trading system’s combined usage of trend lines and support/resistance zones.
To find the trend, let’s utilize the AutoTrendLines indicator.
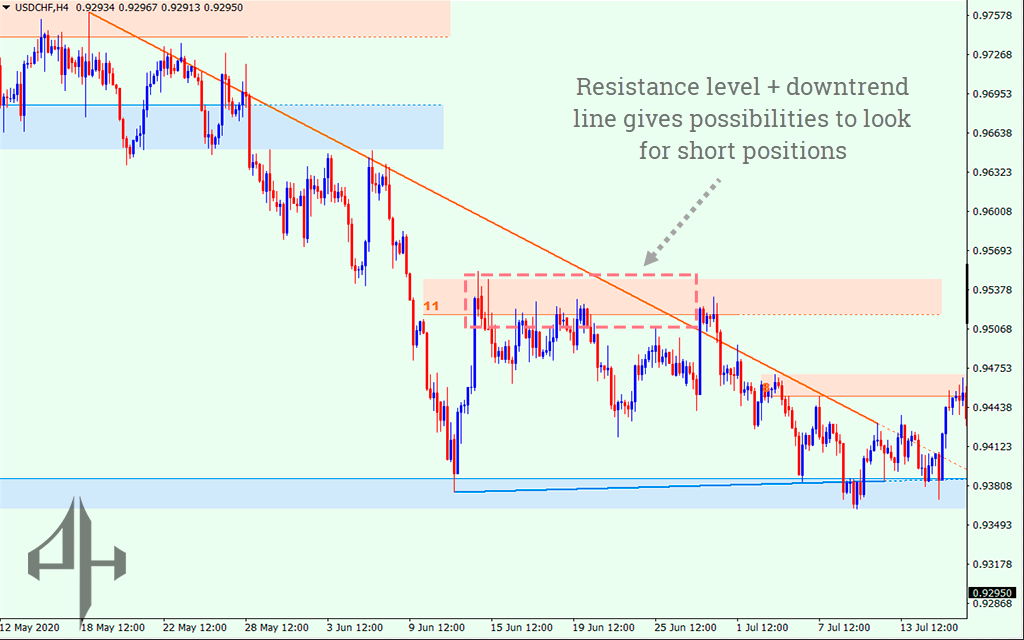
In this instance, the downtrend line and the resistance zone together allow for the consideration of sell positions.
Likewise, as in the example of the flat. Both during the trading day and in the medium to long term, sales from the resistance zone might be taken into consideration.
As a result, the Auto Support & Resistance Zones Indicator can end up becoming a crucial tool for chart interpretation. Almost any trader may make effective use of the Support and Resistance zones indicator in their trading system due to its great efficiency and variety of settings.
Be the first to review “Auto Support & Resistance Zones Indicator, Unlock Hidden Market Barriers”
There are several settings on the indicator. Nonetheless, any trader may incorporate the Auto Support & Resistance Zones Indicator into his trading system and make good use of it because of its simplicity and informativeness.
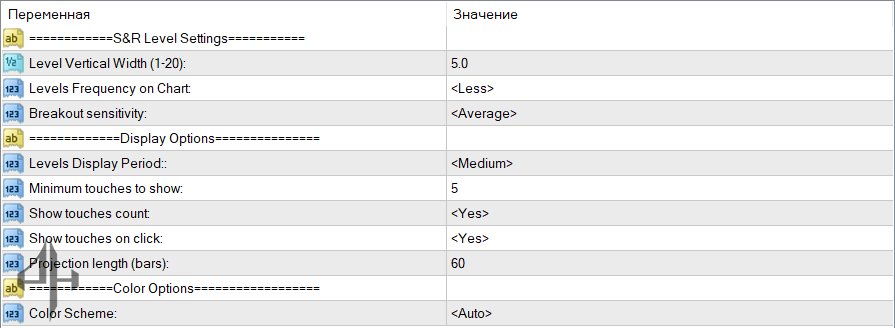
Level Vertical Width – Sets the thickness of the support and resistance zones on the chart.
Levels Frequency on Chart – Determines how many support and resistance levels are displayed on the chart.
Breakout Sensitivity – Adjusts how responsive the indicator is to breakouts.
- High sensitivity means levels are updated less frequently and are marked as broken more easily.
- Low sensitivity results in more frequent updates, with breakouts being less likely to invalidate a level.
Levels Display Period – Specifies the time range over which the support and resistance levels are shown.
Minimum Touches to Show – Sets the minimum number of price touches (fractals) required for a level to be displayed.
Show Touches on Click – Displays the fractals that formed a level when you click the touch count at the beginning of a support/resistance line.
Projection Length (Bars) – Defines how many bars ahead the support and resistance levels will be projected.
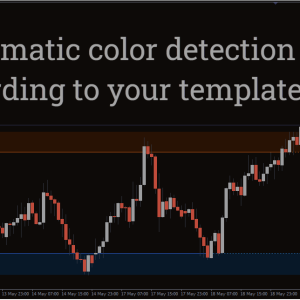
Color Scheme – Lets you customize the visual appearance by selecting a preferred color theme.
Reviews
There are no reviews yet.