

- Description
- Reviews (0)
- Indicator Settings
Description
Excellent candidate for Candle Patterns Indicator detection. Indicator for those who enjoy price activity. For price action traders, candle patterns are a preferred indication. The forex market has a wide variety of candlestick patterns, which can be divided into two categories: bullish and bearish. One or more candles often make up the candle patterns. The Doji, pin bar, morning star, hammer, evening star, shooting stars, enveloping pattern, harami, and piercing line are a few examples of typical candlesticks.
The Candle Patterns Indicator a continuance or reversal of the trend, depending on where they show up on the market. Therefore, knowing candlestick formation properly aids traders in forecasting the probable direction of the market.
You may readily recognize these patterns with your unaided eyes if you have studied them for a long period. However, attempting to recognize the candle pattern while moving from bar to bar might be a challenging endeavor. For this reason, you must have the free MT4 Candle Patterns Indicator.
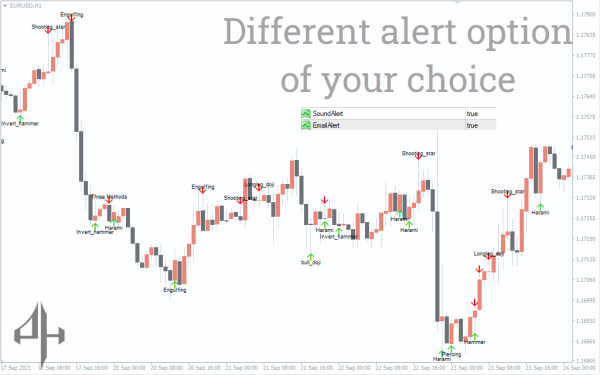
The Candle Patterns Indicator shows the alert signal after detecting the candlesticks. Furthermore, an arrow indicates to the particular candlestick.
Traders can take advantage of trading chances by using the indicator. For example, you can modify your holdings in response to a probable breakout or reversal. The candle pattern indicator is also applicable to all time periods and currency pairs.
The Operation of the Candle Patterns Indicator
The Candle Patterns Indicator is comparatively simple to use. Mounting the indicator on the price chart is all that is required; it will take care of the rest. You may adjust notification settings and select patterns using the indicator. The indicator will scan the chart and mark the most common candle patterns after you have selected your preferred settings.
A bearish candle pattern is indicated if the arrow is visible on top of the candlestick. On the other hand, a bullish candlestick is indicated by an arrow beneath it.
The best aspect is that you won’t have any trouble recognizing the candlestick’s name. You can benefit from the indication in three important ways. It first assists you in setting the trailing stops, exit signals, and entry signals.
Keep in mind that not all candle patterns are appropriate for trading. Accordingly, you should only trade the bullish candle pattern when the market is rising. Only a bearish candlestick will serve for a downturn. Additionally, you should only take into account the candle pattern that shows up on the resistance and support zones.
Chart Example
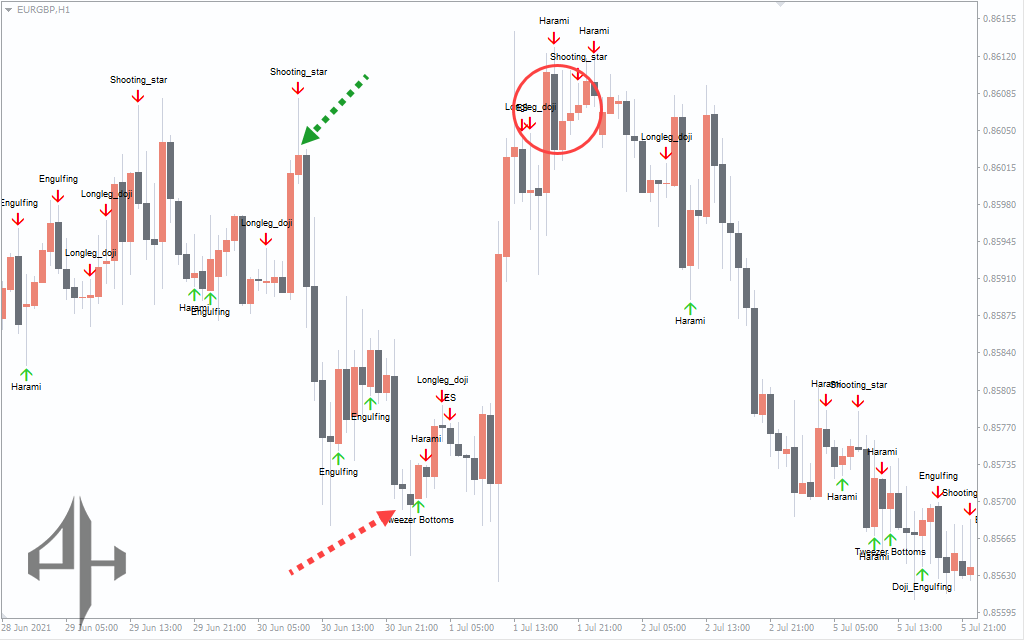
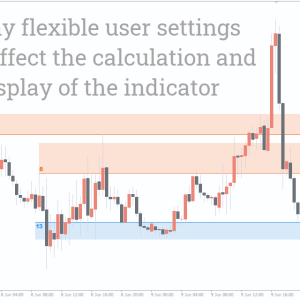
The price movement for Euro vs the British Pound pair over one hour is shown on the chart above. The indicator of the candle pattern searches the price chart and marks the candle patterns. The green arrow points, for example, at a shooting star. Recall when the shooting star from resistance level or a new high signals possible reversal. Actually, the EUR/GBP declines strongly following the candle pattern.
Furthermore see the Doji formed at the support level shown by the red arrow. Some time later, the price increases noticeably. Analogously, the circle points in a hammer pattern. The pattern indicates a possible reversal of the market since it takes place in a resistance zone. Once more, the price drops after varyingly testing the degrees of resistance.
Conclusion
For technical analysts that enjoy price action approach, candle patterns are among the effective instruments. You can avoid looking through the charts in search of the Candle Patterns Indicator though. To improve your trading outcomes, the chart pattern indicator instead labels and recognizes all the popular Candle Patterns Indicator. Generally speaking, a candlestick chart pattern is a very good technical analysis tool.
Be the first to review “Candle Patterns Indicator, Unleash Powerful Market Signals”
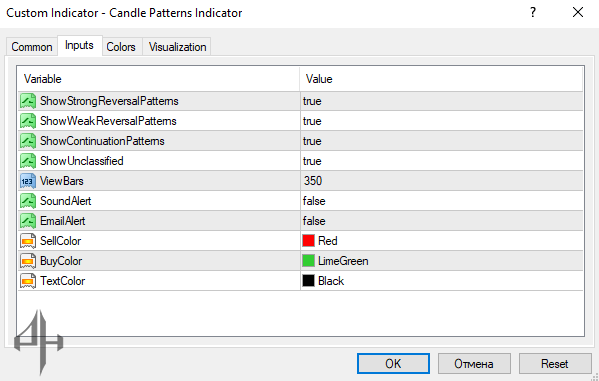
Display Strong Reversal Patterns: Toggle the visibility of significant reversal patterns on the chart.
Display Weak Reversal Patterns: Allows the indicator to show less prominent reversal signals.
Display Continuation Patterns: Enables the display of candlestick patterns that suggest a continuation of the current trend.
Display Unclassified Patterns: Shows additional patterns that don’t fall under standard classifications.
Pattern Detection Range (View Bars): Sets the number of historical bars the indicator analyzes to identify patterns.
Enable Sound Alerts: Turns on audible notifications when a pattern is detected.
Enable Email Alerts: Choose whether to receive email notifications when a pattern appears on the chart.
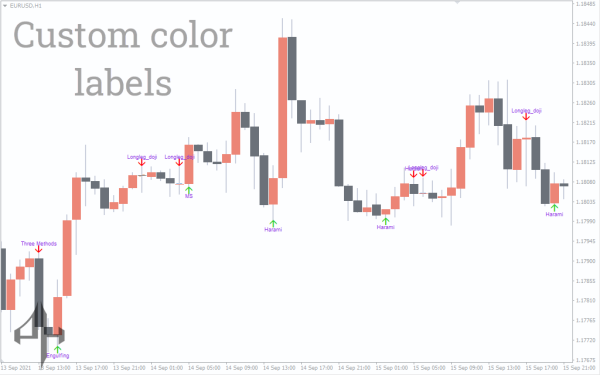
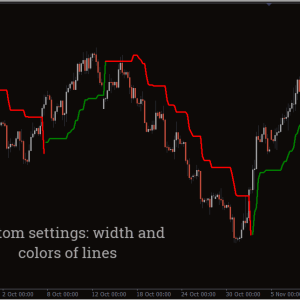
Bearish Signal Color (Sell): Defines the arrow color for bearish (sell) signals.
Bullish Signal Color (Buy): Sets the arrow color for bullish (buy) signals.
Pattern Label Color (Text): Determines the color used for displaying pattern names on the chart.


Reviews
There are no reviews yet.