
- Description
- Reviews (0)
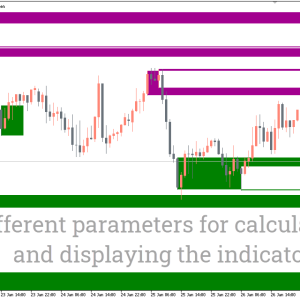
- Indicator Settings
Description
The Engulfing Indicator is very user-friendly and accurate. An ideal tool for trend reversal detection. The phrase “engulfing pattern” (eng-pattern) is likely familiar to technical forex traders. Don’t worry if you haven’t. The eng-pattern is what happens when one candlestick totally covers the one before it, as the name suggests. In essence, the pattern, which can be found in the overall or counter-trends, indicates a potential trade reversal.
The free MT4 Engulfing Indicator finds engulfing patterns in the chart by scanning the market. This eliminates the need for you to perform the laborious task of manually recognising the pattern. The indicator even goes so far as to distinguish between bullish and bearish engulfing and labels them appropriately.
As a result, both novice and experienced traders can use the Engulfing Indicator. The indicator’s versatility across various currency pairs and timeframes is its finest feature. Additionally, you can adjust the parameters to suit your own tastes using the indication.
Using the Engulfing Indicator for Trading
In essence, the eng-patterns indicate the areas of concentrated market pressure. Specifically, the bullish engulfing indicates that the market is being dominated by purchasing pressure. To put it another way, there are more buyers than sellers, which drives up prices. The price is pushed down when there are more vendors than customers.
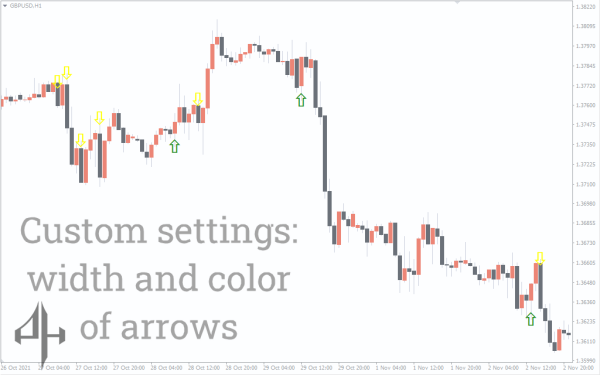
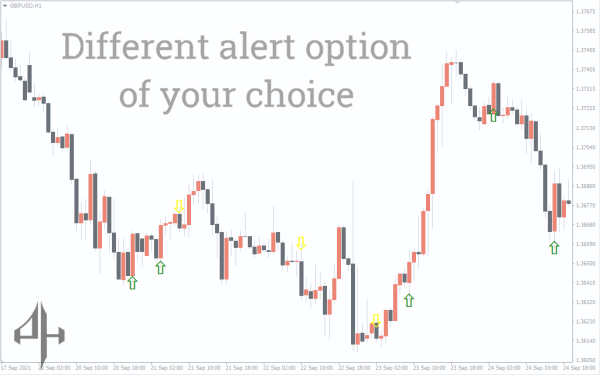
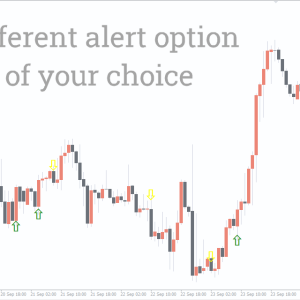
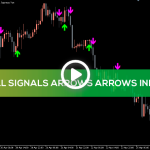
When the indicator detects a bullish engulfing pattern, it publishes a blue arrow heading upward; when it detects a bearish engulfing pattern, it posts a red arrow pointing downward. It is your responsibility to recognise the arrows and make the appropriate trades. To bolster the signal, it is wise to employ additional confirmation filters such as trend lines and moving averages.
Furthermore, the indicator performs best in areas of support and resistance. In other words, when the red arrow appears on the support area and the blue arrow (bullish engulfing) emerges on the resistance areas, the signal is powerful.
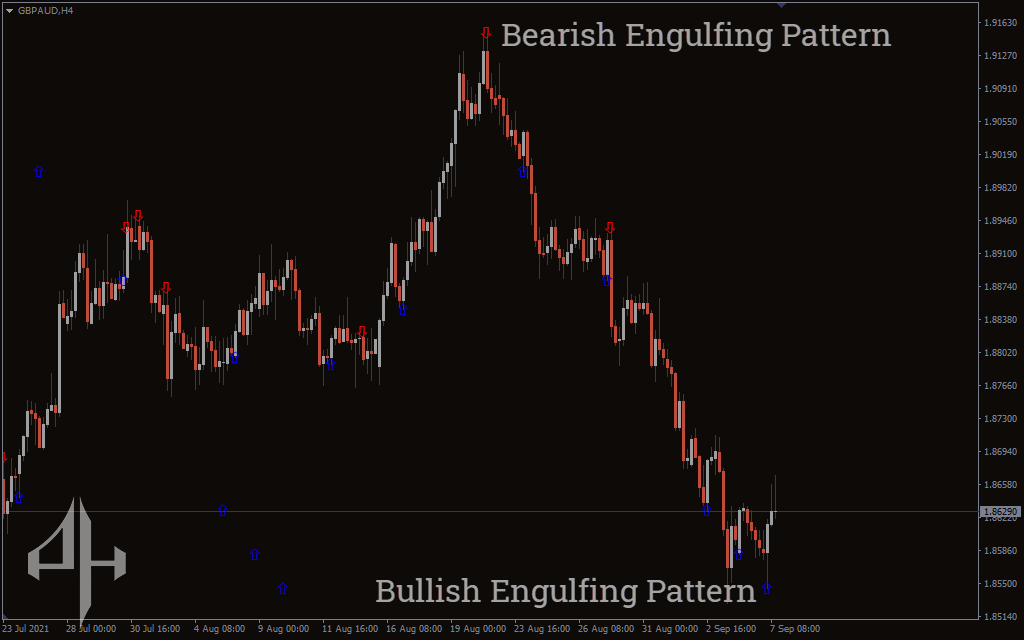
The price fluctuation of the British pound in relation to the Australian dollar is depicted in the above chart. The indicator looks for engulfing patterns on the chart. For example, a red arrow posted by the indicators indicates that the engulfing pattern is bearish. Observe how a double touch creates the pattern (shown by the arrow). The pattern is therefore a signal with a high probability. In actuality, following the indication, the markets see significant bearish action. At new lows, the market is currently forming a bullish engulfing pattern. An appropriate location to enter a long position is indicated by the blue arrows.
Conclusion
One of the most widely used and lucrative candlestick patterns is the engulfing pattern. The trader no longer has to put in the effort to find the pattern on the chart thanks to the Engulfing Indicator. By displaying bullish and bearish arrows, it also helps investors decide whether to buy or sell. The indicator will find the patterns for you if you only mount it on the chart. Profits begin to flow in as soon as you trade appropriately. As with most indicators, you should confirm with other tools.
Be the first to review “Engulfing Indicator, Master Engulfing Strategy”
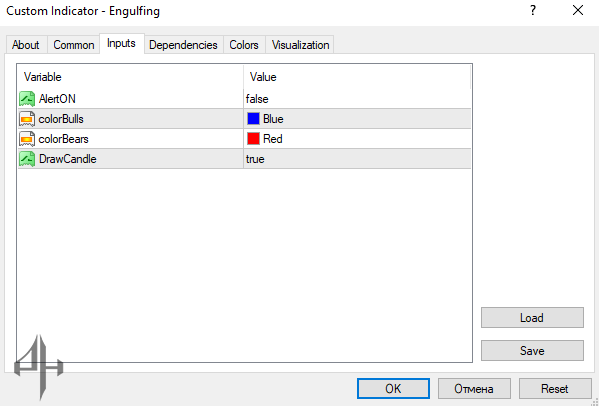
Alert On: Allows or prohibits receiving notifications.
Bulls Colour: Determines the colour of the bull arrows.
Colour Bears: Determines the bearish arrows’ colour.

Reviews
There are no reviews yet.