
- Description
- Reviews (0)
- Indicator Settings
Description
Have you been struggling to identify the current trend in the market? You may have heard the adage “always trade with the trend” a lot, but you may not even be aware of when the market is rising or falling. The Keltner channel (KC) indicator for MT4 is what you require.
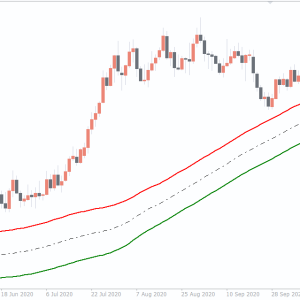
The Keltner Channel Indicator On MT4
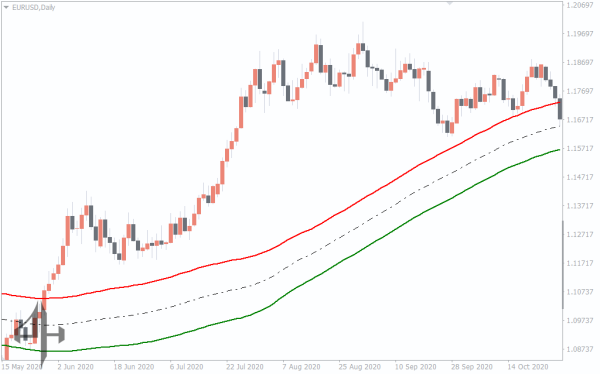
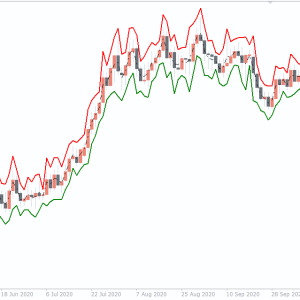
 Price restriction to the upper half of the channel is how the KC indicator indicates an uptrend. The price occasionally oscillates between the upper and middle bands.
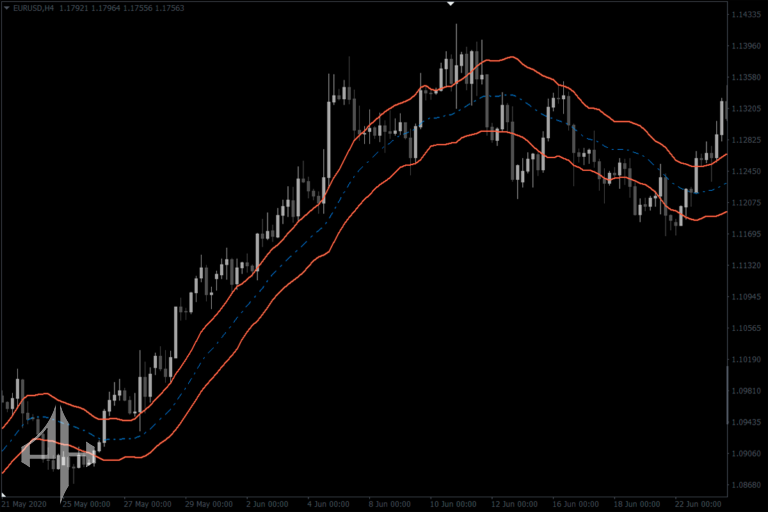
On the MT4 platform, the Keltner Channel Indicator consists of three bands, two of which are the upper and lower bands. The middle of the other two lines is where the third band remains. The price typically oscillates between the bands based on the indicator’s parameters.
The use of this indicator has numerous benefits.
- Finding market trends is one of the Keltner channel’s most popular applications. An uptrend is indicated when the channel is upside down. Additionally, a dip indicates a downtrend.
- The Keltner channel can be used to identify actual possible trend reversals in addition to identifying big trends with ease.
Competing indicators perform most of the functions of the Keltner Channel Indicator. The Bollinger Bands indicator is one fierce competitor.
However, the Keltner Channel Indicator calculating formula gives it an advantage over these competing indications. Additionally, the indicator does not respond to the market too closely at its default level due to this algorithm. The indicator becomes more resistant to misleading breakout indications as a result. To change how quickly or slowly the channel responds to the market, a trader can change the settings.
How Do You Calculate an Indicator?
The Keltner Channel Indicator computes its bands using information from the ATR (Average True Range) and the EMA (Exponential Moving Average).
- Upper Band: Calculated by adding the product of the ATR and a multiplier to the EMA.
- Lower Band: Determined by subtracting the product of the ATR and a multiplier from the EMA.
- Middle Band: Represents the Exponential Moving Average (EMA) itself.
Because the EMA takes into account the most recent price movements, the channel uses it. The 20-period EMA is the default EMA period. A more lagging Keltner channel is the result of a larger EMA. On the other hand, a channel with a smaller EMA is more sensitive.
The purpose of the ATR is to provide a picture of the price’s recent volatility at a given moment. For the computation, 10 is the default ATR parameter. The channel’s width is determined by the multiplier. Wider channels result from larger multipliers, while narrower channels result from smaller multipliers. On MT4, the Keltner channel’s default multiplier is 2.
How To Trade With The Keltner Channel Indicator
The following are the most widely used trading methods with the indicator, while more experienced traders may have other uses for it:
● Dynamic Support and Resistance in trends
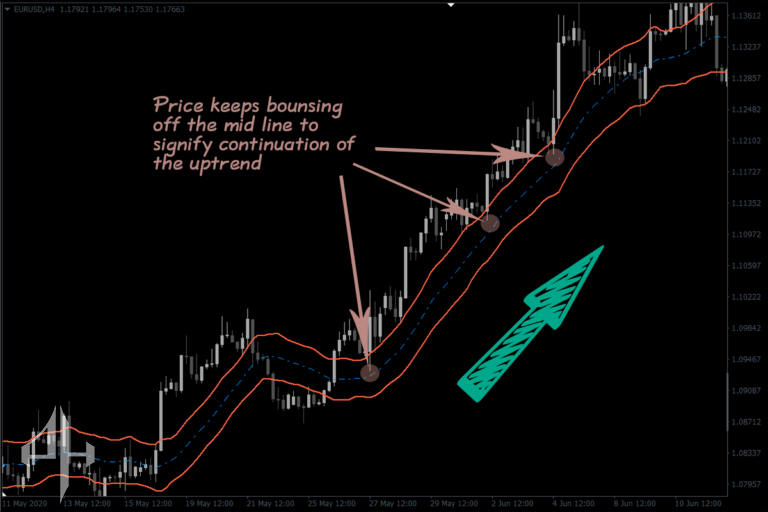
You may identify market trends and trade with them by using this method. The market trend is shown by the channel’s angle. The market is in an uptrend when the channel is upturned, and it is in a downtrend when the channel is downturned.
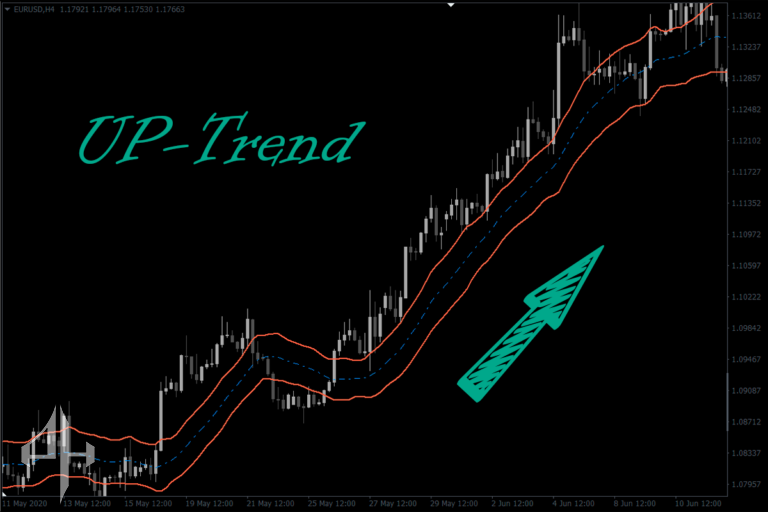
Price restriction to the upper half of the channel is how the KC indicator indicates an uptrend. The price occasionally oscillates between the upper and middle bands.
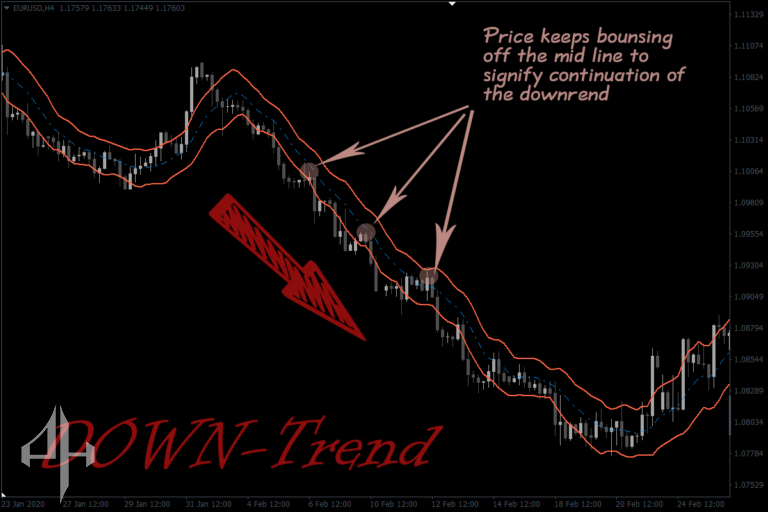
The market confines itself to the lower part of the channel during a decline. Additionally, until the trend ends, the price may oscillate between the lower and mid bands, much like in an uptrend.
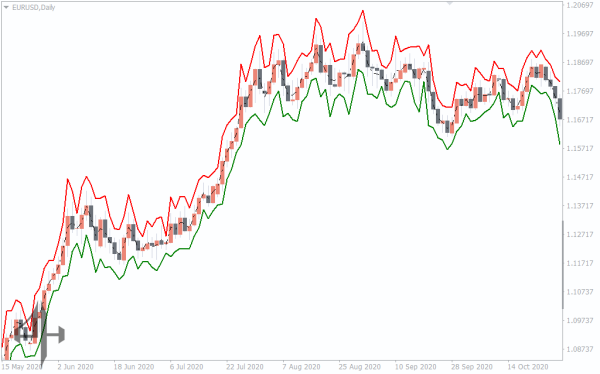
● Breakouts
Another excellent source of breakout signals is the Keltner Channel Indicator. The price frequently opens inside the channel and closes outside of it. When this occurs, it indicates that the price will likely stay moving in the breakout’s direction for some time. Occasionally, these breakouts signal the start of significant market trend movements.
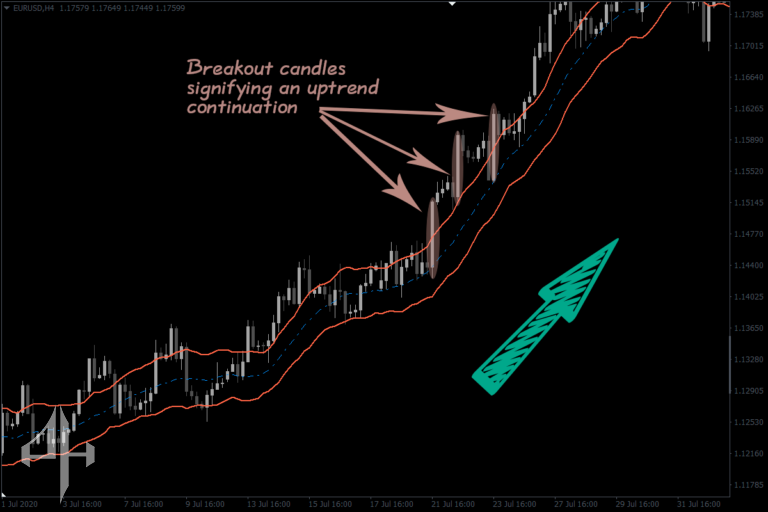
This is a picture of a potential trade situation:

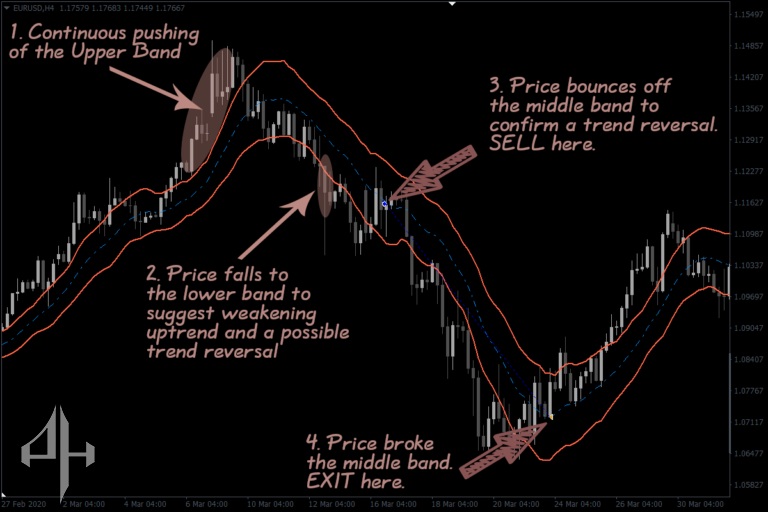
● Trend Reversals
For traders of reversal trends, the Keltner Channel Indicator also provides some potent signs. The uptrend may be losing steam if the price settles within the lower band after repeatedly hitting the upper band without dropping to the lower band.
Additionally, during a downturn, the price repeatedly hits the lower band before returning to the upper band, indicating that the market may be poised to be overtaken by the bulls.
Who Is Indicator Best For
For novice forex traders who are struggling to identify market trends, the Keltner channel is ideal.
A significant component of many trend and trend reversal traders’ trading indicators is the Keltner channel. This is due to the fact that the indicator offers traders of both trends and trend reversals strong signals.
Be the first to review “Keltner Channel Indicator, Boost Your Trading Edge”
One of the parameters in the settings is the Keltner Channel indicator: period.
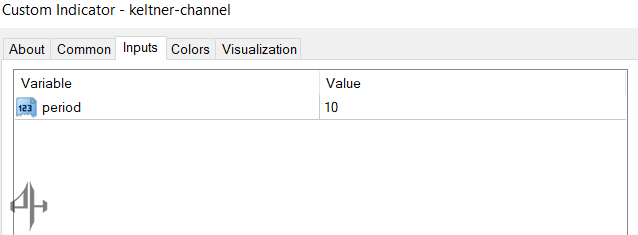
- Period: With this option, you may adjust the Keltner Channel’s EMA parameter to ascertain its sensitivity.
By typing “ctrl + I” and double-clicking on the indicator, you may access these Keltner channel indicator settings on your MT4. The options are located under the “input” tab.
Reviews
There are no reviews yet.