
- Description
- Reviews (0)
- Indicator Settings
Description
Since the regular MetaTrader 4 MACD oscillator has been upgraded and improved, we would like to introduce you to the free custom MACD 2 Line Indicator. Regretfully, certain common MT4 indicators lack the necessary tools to assess shifting conditions in the Forex market. The employment of robots and algorithms during trading is another factor contributing to this, in addition to the increase of actual players.
Contents:
1. Description
2. Features
3. Trading signals (alerts)
4. Settings
1. Description MACD2Line
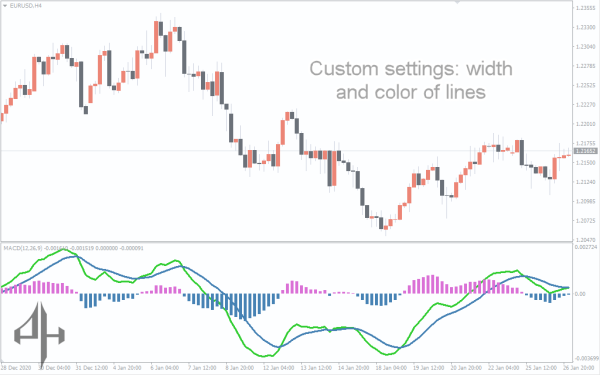
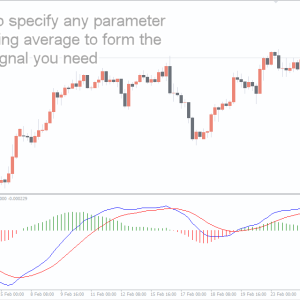
In a different chart window, the MACD 2 Line indicator displays the volume histogram and moving averages (also known as the exponential moving average, or EMA).
There is also a zero line on the indicator. An overbought zone is the full area above the line, and an oversold zone is the area below it.
The likelihood of a downward trend reversal increases with the moving averages’ elevation above the zero line. The likelihood of reversing the upward trend increases if the EMA is below the zero line.
The MACD2Line is automatically a member of the oscillator group. Therefore, when the global trend and the smaller trends shift to the opposing ones, it would be better to use the indicator.
Regardless of your trading strategy—swing, intraday, or long-term—the indicator can be a useful addition to your trading system.
There will be more entry points if you use swing and intraday trading strategies and favor shorter EMA durations. As a result, there is a greater chance of initiating lucrative trades during short-term trend reversals.
You will have fewer entry points if you would rather keep your positions open over the medium and long term while extending the moving average durations. However, they can be more trustworthy!
2. Features MACD 2 Line Indicator
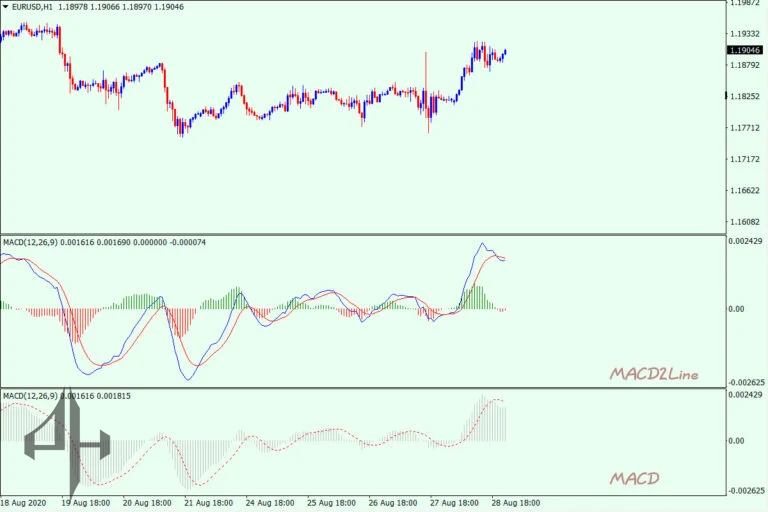
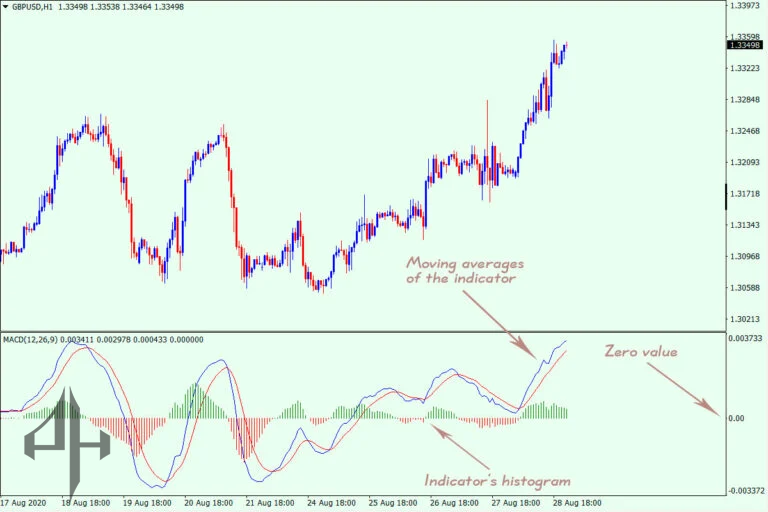
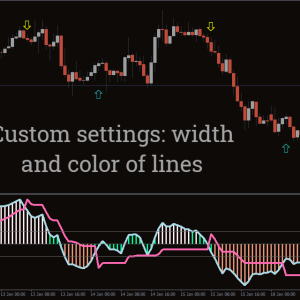
The fast EMA and the slow EMA are the first two moving averages that the indicator draws. The colors of these two lines differ: the slow line is red, and the quick line is blue. When the fast line crosses the slow line, entry signals are produced.
Second, there are two colors present in the histogram volumes: red and green. Selling should be your only option if the volume color is red; purchasing should be your only option if the volume color is green.
Third, the indicator’s zero line may be a more useful supplementary trading signal than the conventional MACD’s.
The MACD 2 Line Indicator separates the indicator’s histogram volumes into bullish and bearish categories, whereas the MACD only has one EMA and a common volume histogram. Additionally, there are more potential trade entry opportunities offered by the second moving average.
3. Trading signals (alerts)
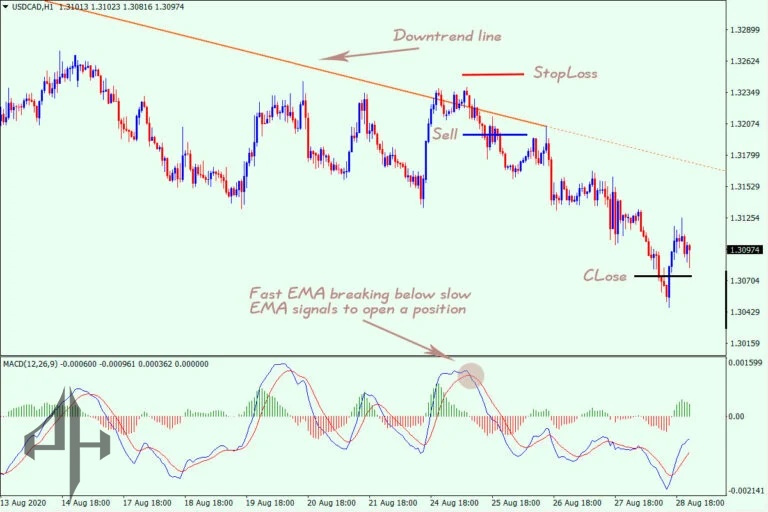
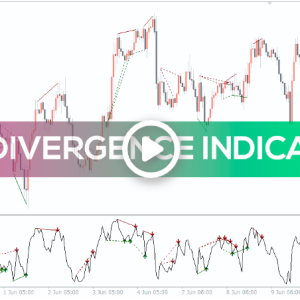
As demonstrated in the sample above, a number of indicators point to a bearish indication. The volume histogram is red, the EMA is in the overbought zone, and the fast moving average crosses the slow moving average to provide a sell entry point.
Examine the downtrend line, which serves as a supplemental signal. We can see the worldwide negative trend till it breaks above, thus we should only think about sell trades.
Setting a stop loss for a potential trade outside of the trendline would be safer, and it would be preferable to close a position when the EMA displays the near-maximum oversold readings (values).
We’ll examine a buy trade on the M15 period to demonstrate how to apply the MACD 2 Line Indicator on various timeframes.
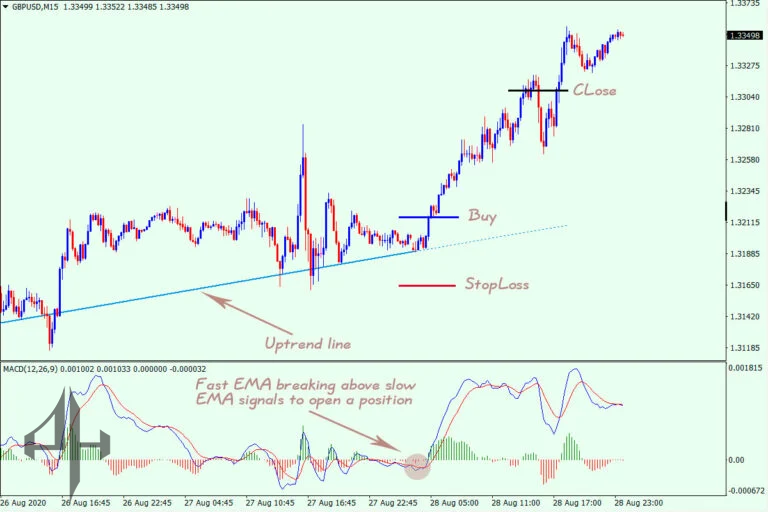
The uptrend line functions as an extra technical analysis tool in this case, just like in the selling example above: we should only search for buying opportunities until it is broken below.
The green histogram volumes, bullish trendlines, and signal all work together to create buying-friendly conditions in the preceding chart. It was produced by the moving averages crossing paths.
A potential trade’s stop loss should be set above the trendline, and the position can be terminated after the maximum overbought readings have been reached.
Be the first to review “MACD 2 Line Indicator, Ignite Your Trade Signals with Clarity”
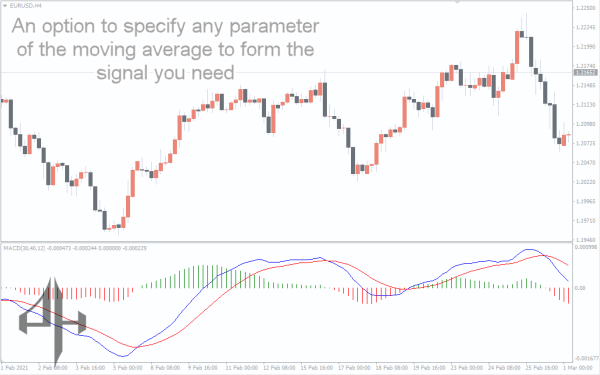
Only the most important elements, the moving average periods, are included in the indicator’s settings. You can select the EMA periods in your trading system that provide the most effective signals for the indicator based on your trading strategy.
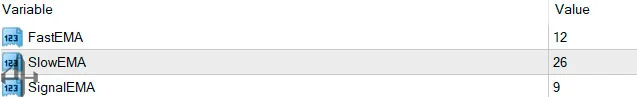
Fast EMA – allows you to select the period of a fast moving average.
Slow EMA – enables you to select the period of a slow moving average.
Signal EMA – allows you to select the period of a signal moving average.
After downloading and installing the indicator, you will need to take some time to adjust the moving averages’ periods.
Don’t ignore the aforementioned concerns; using the MACD2Line indicator in conjunction with your primary trading strategy or other indicators will ultimately improve your chances of generating dependable and profitable transactions.


Reviews
There are no reviews yet.