
- Description
- Reviews (0)
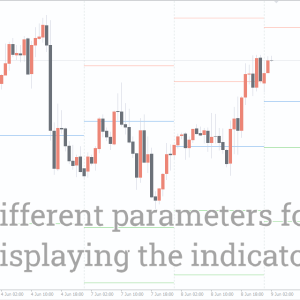
- Indicator Settings
Description
All of the fundamental techniques for creating reversal levels are combined in the Pivot Points.All-In-One Indicator. so that you may include it into your trading system with ease.
One of the most widely used instruments in the forex market is the support and resistance levels.
Due to their high accuracy in identifying the reversal points (pivot points) of trends and tendencies, they have become increasingly popular.
By default, there is no indicator on the MT4 interface that would create these levels on its own.
See our post for information on how to solve this problem with a free Pivot Points.All-In-One Indicator.
What is a Pivot Points.All-In-One Indicator?
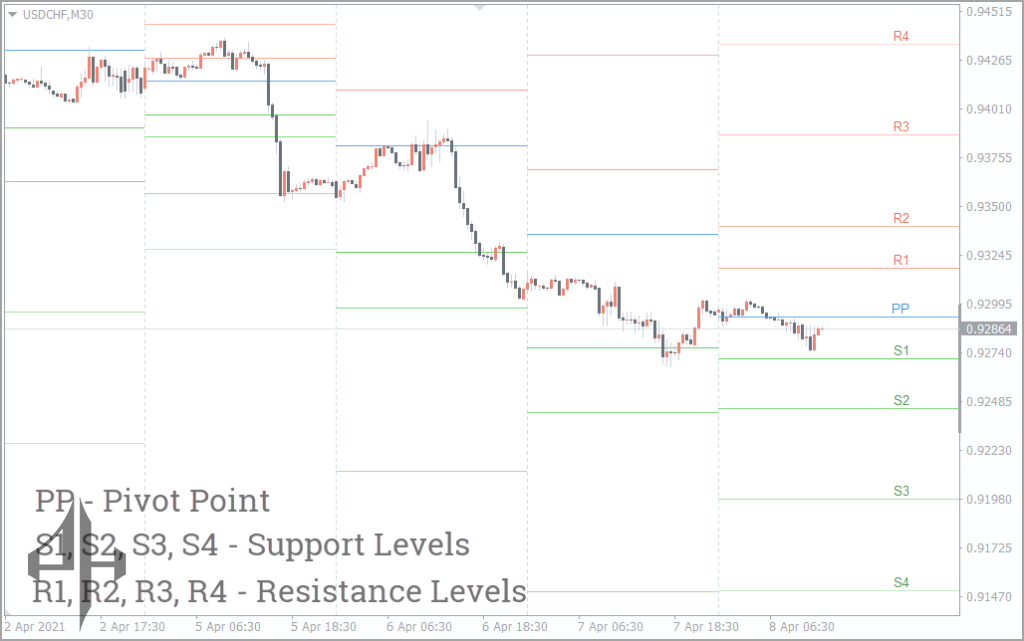
Levels are automatically plotted on the MT4 terminal chart by the Pivot Points.All-In-One Indicator. The price can alter its course of movement by engaging with these levels.
Consequently, this presents possible chances for lucrative transactions.
This indicator is special because it incorporates all of the fundamental and widely used techniques for creating reversal levels. These include Camarilla, Fibonacci, Woodie, Classical, and Central Pivot Range (CPR).
Please be aware that there are other ways to draw pivot levels using the Pivot Points.All-In-One Indicator. On the MT4 terminal chart, however, they are all marked in the same manner.
The only differences between the various techniques are the mathematics that underlie them. Thus, that determines the precise position of the levels on the chart.
We will now go over each of the pivot level drawing techniques in brief. We will also demonstrate each one’s utility. This will assist you in determining which strategy will be most beneficial to you.
But let’s mention it at once. Though the indicator shows the possible trend reversal points, it is not recommended to use it without being tied into the main trading system.
Approaches for Plotting Reversal Levels in the Pivot Points.All-In-One Indicator
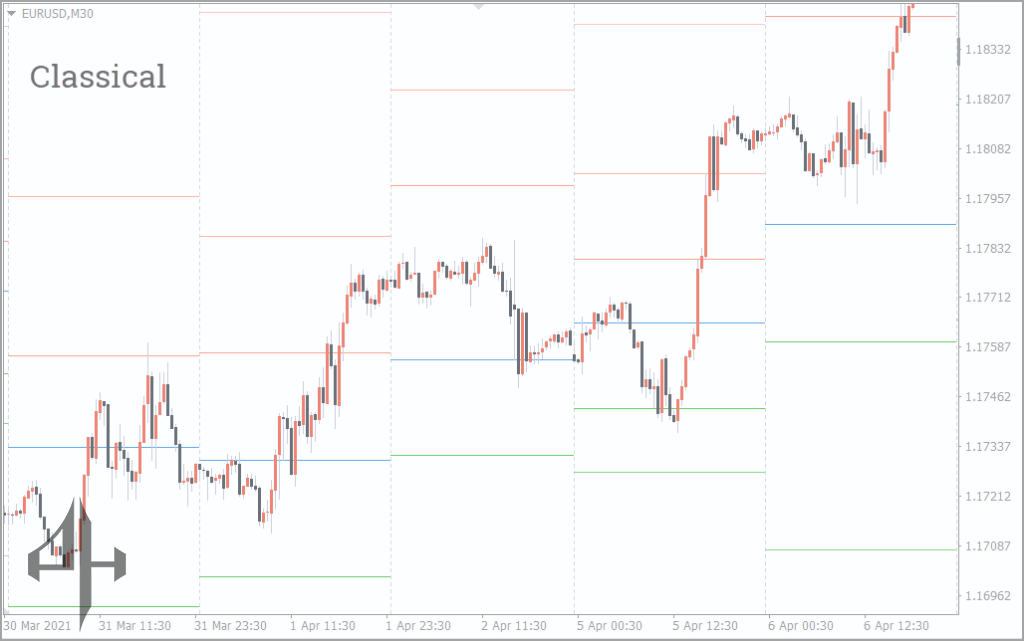
Classical
This method’s ease of use in creating pivot levels makes it one of the most widely used.
A Pivot Points.All-In-One Indicator can be calculated using just three parameters. They represent the closing price as well as the high and low of the most recent trading session. The percentage of this method’s connection with the price is rather high because it is preferred by many forex traders.
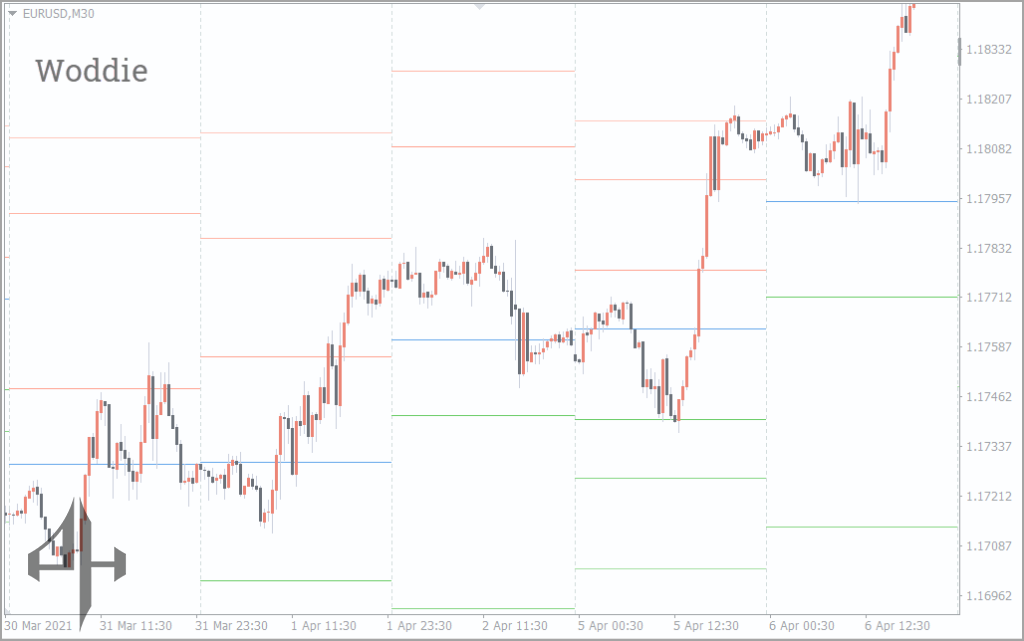
Woodie
In comparison to other methods of constructing pivot levels, this approach differs in increased attention to the closing price of the previous period.
Thus, the probability of a trend reversal near the pivot point is increased.
Regardless of how long you hold open positions and for what purposes, this method of displaying reversal levels can be useful for you. After all, determining the most probable trend reversal point initially increases the chances of opening profitable positions.
Fibonacci
The classical Fibonacci theory is inextricably linked to this technique for drawing pivot levels. It is frequently employed to pinpoint the locations where the global trend resumes after a reversal.
Therefore, pivot points created using the Fibonacci method may be useful to you if you are a mid-term trader who like to trade in the main trend.
After a correction, this technique might assist you in identifying perhaps lucrative entry positions to rejoin the main movement.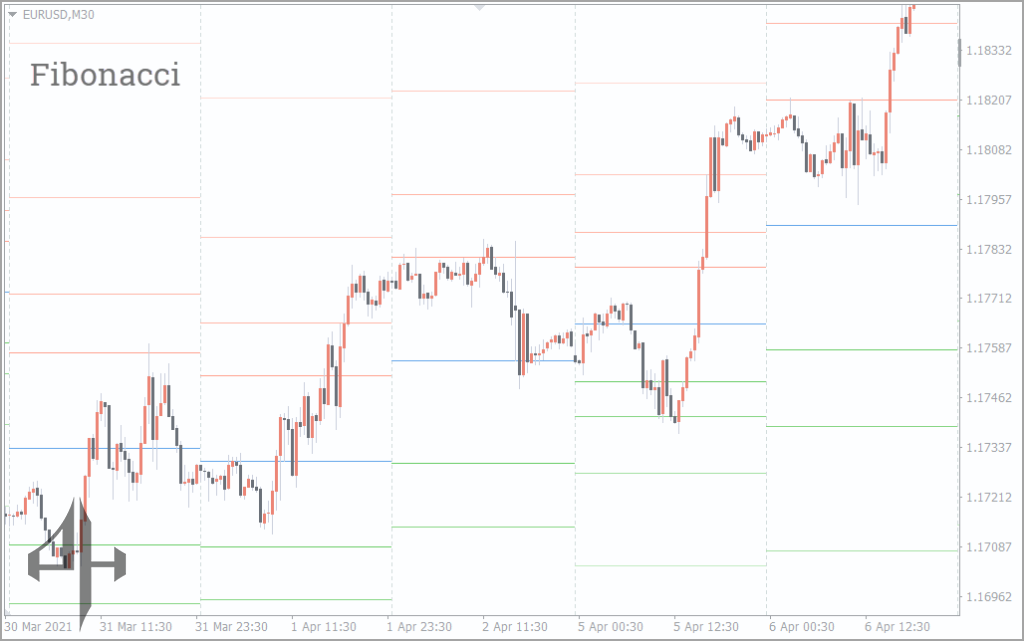
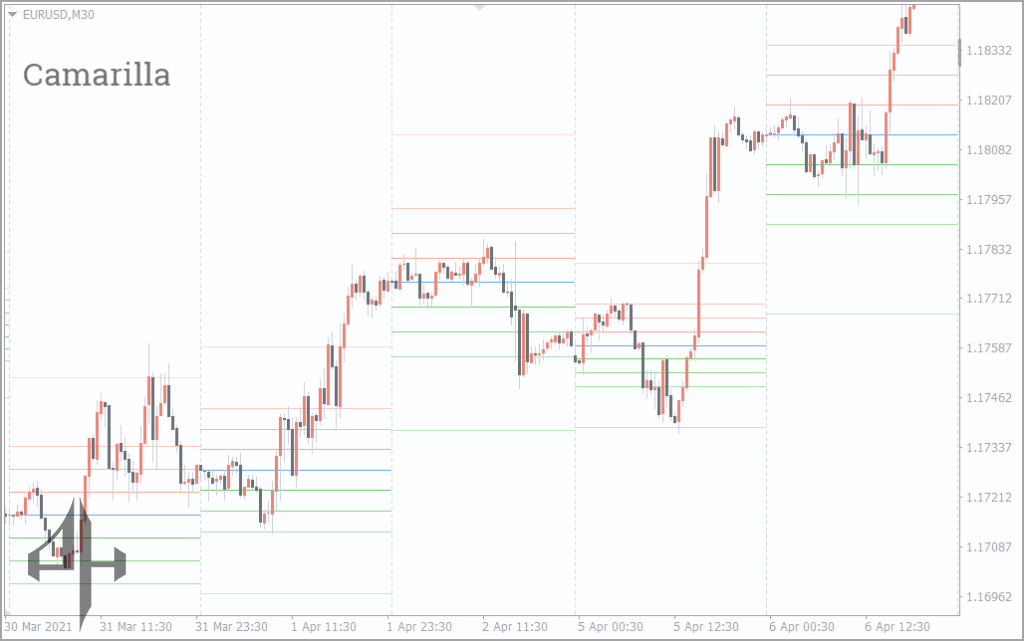
Camarilla
The proximity of the resistance and support levels to the reversal level is a characteristic of pivot point construction employing this method.
This approach is most likely the best for you if you are a scalper or an active intraday trader.
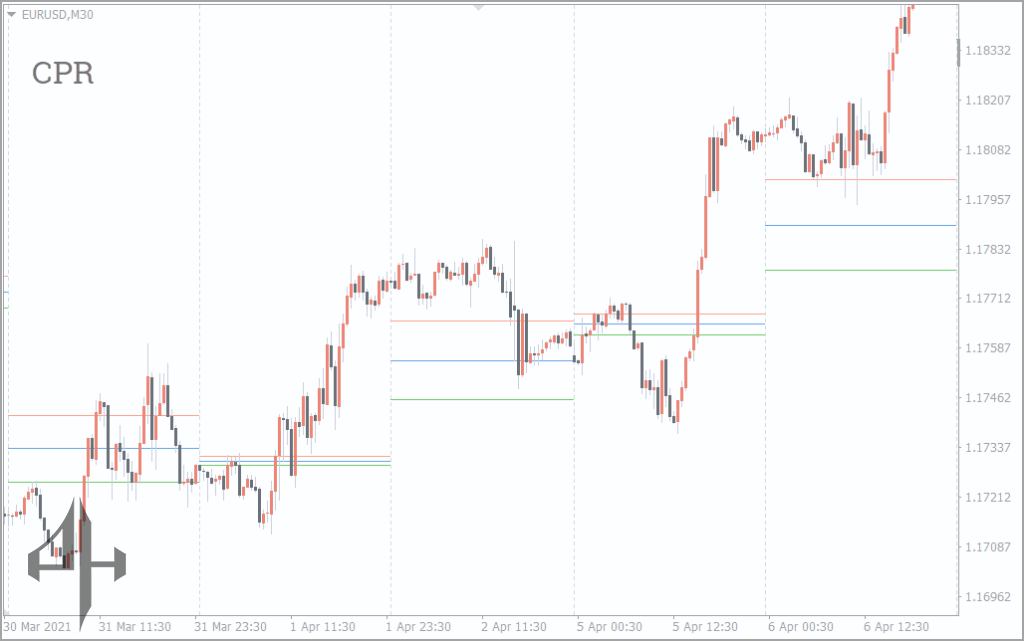
CPR
This approach differs slightly from the others in terms of appearance.
The primary pivot level and the higher and lower levels in relation to the main one are its only three lines.
In actuality, this method aids in identifying the primary trend when applied to the M30 era and beyond.
An upward trend is indicated if the price consistently remains above the three preset thresholds.
The uptrend is weakened if the trading day ends below each of the three levels. This could signal a shift to a downward trend.
All traders can benefit from the CPR approach. One of the first and most important tasks in analyzing the forex market is figuring out whether the market is in a trend or flat phase.
Problems Solved by the Pivot Points.All-In-One Indicator
Following a quick recap of the pivot levels, let’s examine the goals that the Pivot Points indication aids in achieving.
In actual use, the indicator can assist in figuring out when to place take-profit and stop-loss orders. as well as in identifying market entry locations that follow the primary trend.
Identifying Trend Continuation Points Using the Pivot Points.All-In-One Indicator
To do this, we’ll employ the Fibonacci levels.
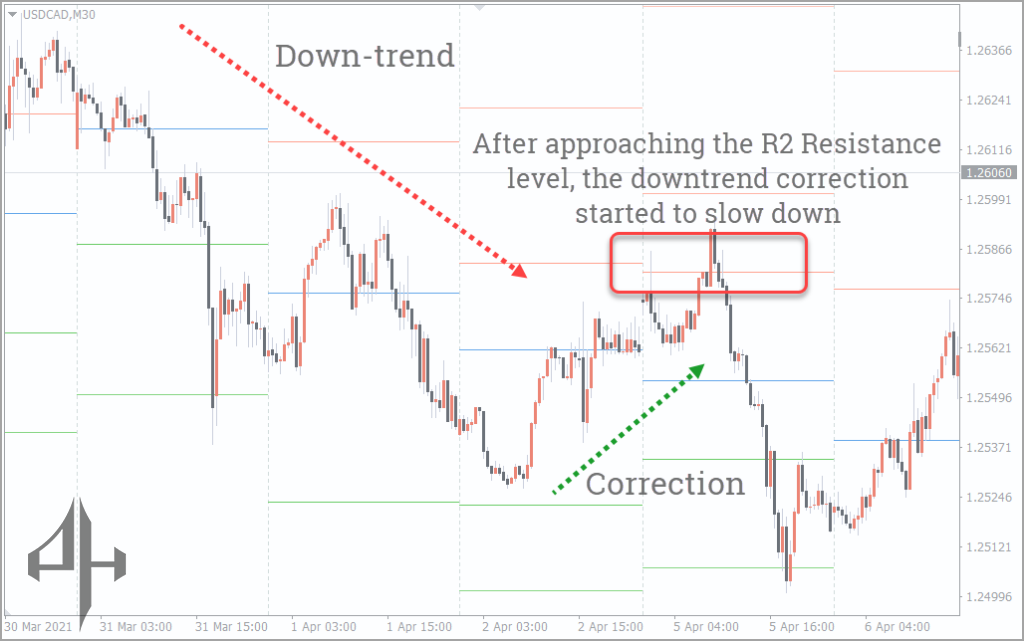
Fibonacci levels differ from other pivot levels, as was previously mentioned. This is because the major movement’s correction is typically determined using this way.
As we can see in the preceding chart, a correction has taken the place of the primary trend.
The price’s decline slows as it gets closer to the S2 support level. The shadows cast by the extended candlesticks and the additional “trampling” of the price in one spot serve as indicators of this.
It is thought that these indications ought to be used once movement in the trend’s direction has been confirmed.
You might attempt to purchase at the market price when the price starts to rise. The stop loss should be positioned behind the S2 support level at the same time.
Establishing Stop Loss and Take Profit Levels Using the Pivot Points.All-In-One Indicator
The most widely used pivot levels by forex market traders are the classical ones. So let’s figure out the Take-Profit and Stop-Loss levels using this strategy.
The aforementioned chart’s trading scenario shows that the price movement range lies between the R2 and S1 levels.
Two price reversals have already occurred at the S1 level. This leads us to believe that the price will once more serve as support when it re-interacts with this level.
Consequently, it is safer to position the Stop Loss behind the S1 level before initiating a possible buy transaction. The problem becomes more complex at the R2 level.
Take note of the price’s lower and lower highs, which illustrate how weak the buyers are.
Naturally, you might wait for the price to turn around close to the R2 level before setting the Take Profit.
However, it is preferable to exercise caution when the market is overtly expressing a reluctance to expand.
As a result, manually closing half of the open positions close to the R1 level is safer. It is preferable to position Take Profit close to the R2 level for the remaining deals.
You have so gone over the Pivot Points.All-In-One Indicator. Now you may use that particular method of drawing the levels in your trading system, which you find the most useful and effective.
Be the first to review “Pivot Points.All-In-One Indicator, All-In-One Powerful Tool”
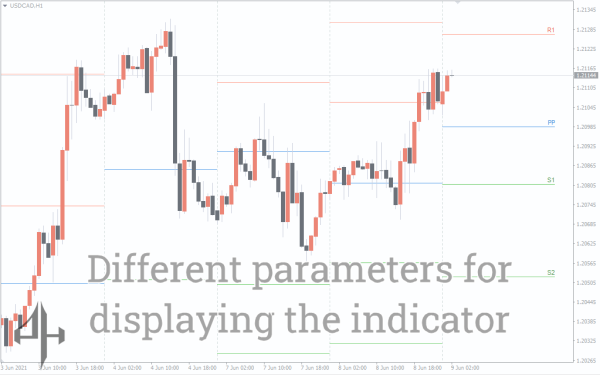
There aren’t many settings for the Pivot Points indicator. Its effectiveness and utility, however, will enable you to make good use of it in your trading method.
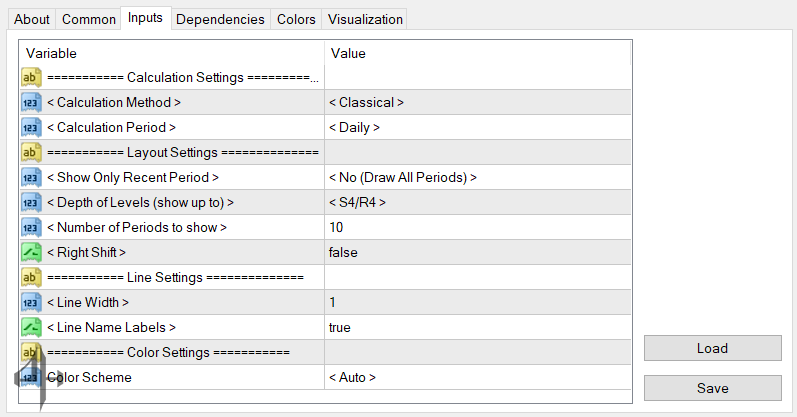
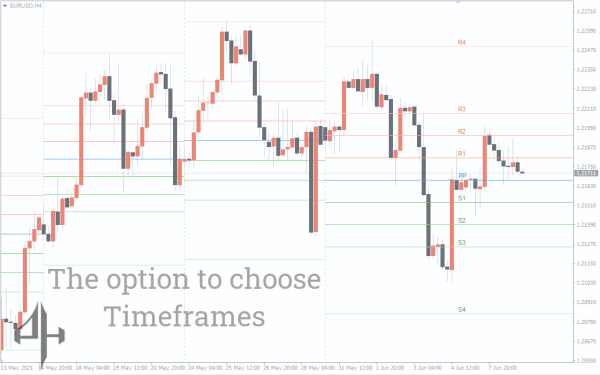
Calculation Method/Period: Lets you choose the calculation method and timeframe for rendering the indicator.
Display Timeframes: Supports timeframe selection ranging from Daily to Monthly.
Show Only Recent Period: Enables filtering to display the indicator for short-term, long-term, or standard periods.
Level Depth (Display Up To): Allows selection of which support and resistance levels to show, from S1/R1 up to S4/R4.
Periods to Display: Sets the number of historical periods the indicator should be shown on the chart.
Right Shift: Toggles whether indicator levels extend to the current price axis on the right side of the chart.
Line Width: Controls the thickness of the S1/R1 to S4/R4 support and resistance lines.
Name Labels: Toggles the visibility of level name labels on the chart.
Color Scheme: Allows selection of a preferred color theme for the indicator display.

Reviews
There are no reviews yet.