


- Description
- Reviews (0)
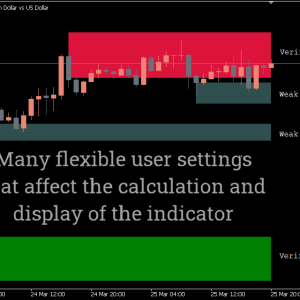
- Indicator Settings
Description
We advise you to take a look at this free Shved Supply & Demand Indicator, which was created to automatically identify and display these kinds of levels. You are probably aware that the ratio of buyers to sellers fluctuates constantly, driving all price changes in the Forex market. By default, there is no indicator on the MT5 terminal that can show the zones where significant shifts in this ratio take place.
1. Overview of the Shved Supply and Demand Indicator
Zones of supply and demand are those where higher activity in the Forex market was previously observed.
We are interested in these values because the price’s frequent interactions with them enable us to identify potentially lucrative trade entry spots.
The Shved Supply & Demand Indicator from which a sufficiently strong intentional movement has already taken place serve as the foundation for the levels.
The price action in the vicinity of the zones determines their height. Visually, the height will be higher if the levels consistently piqued traders’ interest and the price moved up or down in response.
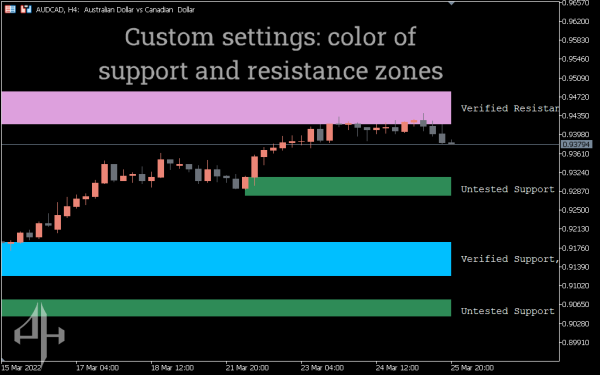
Every figure on the chart has a little text description for convenience, so you won’t have any trouble knowing what the highlighted level implies.
Shved Supply & Demand Indicator, like the majority of Forex market indicators, provides more dependable signals over longer time periods. The reason for this is that the lower timeframes have a considerable degree of market noise.
Additionally, bear in mind that supply and demand zones can be more accurate the more frequently the price has tested them.
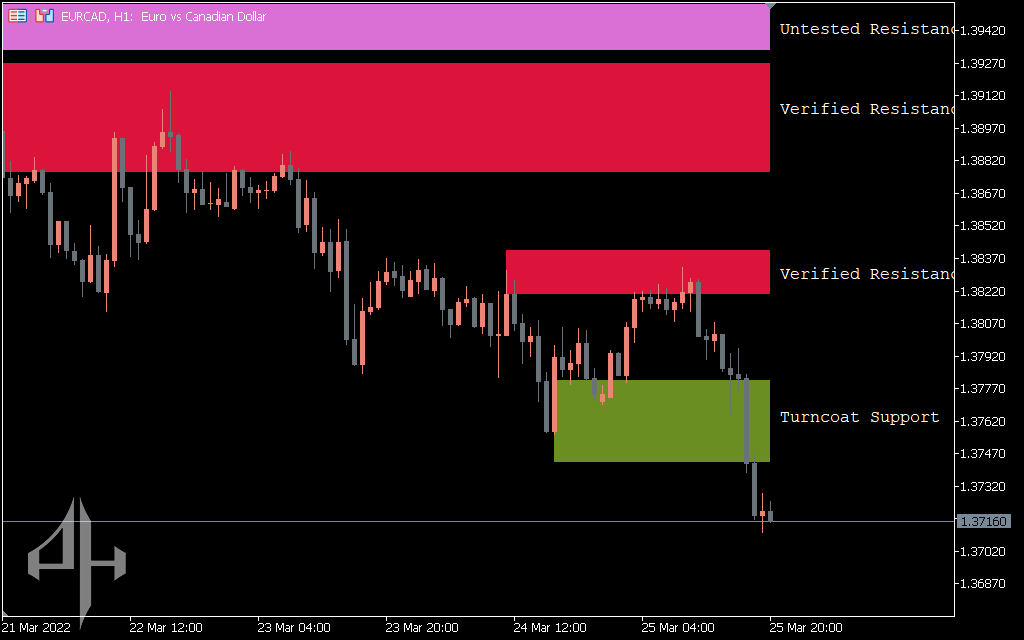
2. Which types of zones are plotted by the Shved Supply & Demand Indicator?
This indicator identifies five distinct types of zones, each representing varying levels of market significance:
-
Weak Zone: Represents areas with little to no noticeable supply or demand. These zones offer minimal trading strength, so it’s best to avoid them or trade with caution.
-
Untested Zone: Zones where price has previously made a strong, directional move but hasn’t yet returned. These indicate potential future reactions due to their historical impact.
-
Verified Zone: Areas that have been tested two or more times, indicating renewed market interest. The indicator shows the number of retests—more retests suggest a stronger zone.
-
Proven Zone: Highly reliable levels that have seen consistent trading activity. Price often reacts strongly here, even potentially causing breakouts and trend reversals.
-
Turncoat Zone: Also known as “mirror levels.” These zones shift roles—previous support becomes resistance or vice versa—due to changes in supply and demand dynamics.
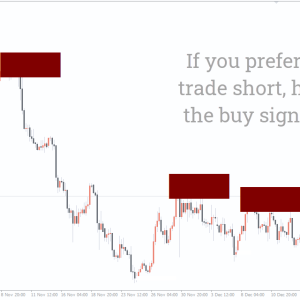
Despite highlighting regions of interest for participants in the Forex market, the indicator’s signals may be more potent when used in conjunction with other trading tools.
By using the Shved Supply & Demand Indicator along with other indicators or with non-indicator trading systems (Price Action and Candlestick Patterns), you will increase your chances of making profitable trades in the Forex market.
Regardless of the trading strategy you choose, the Shved Supply & Demand indicator might be a helpful addition. In actuality, there will be a far higher likelihood of restarting movement from the trading activity levels that the indicator displays.
Be the first to review “Shved Supply & Demand Indicator, Master Market Movements”
The following parameters are part of the indicator’s settings:
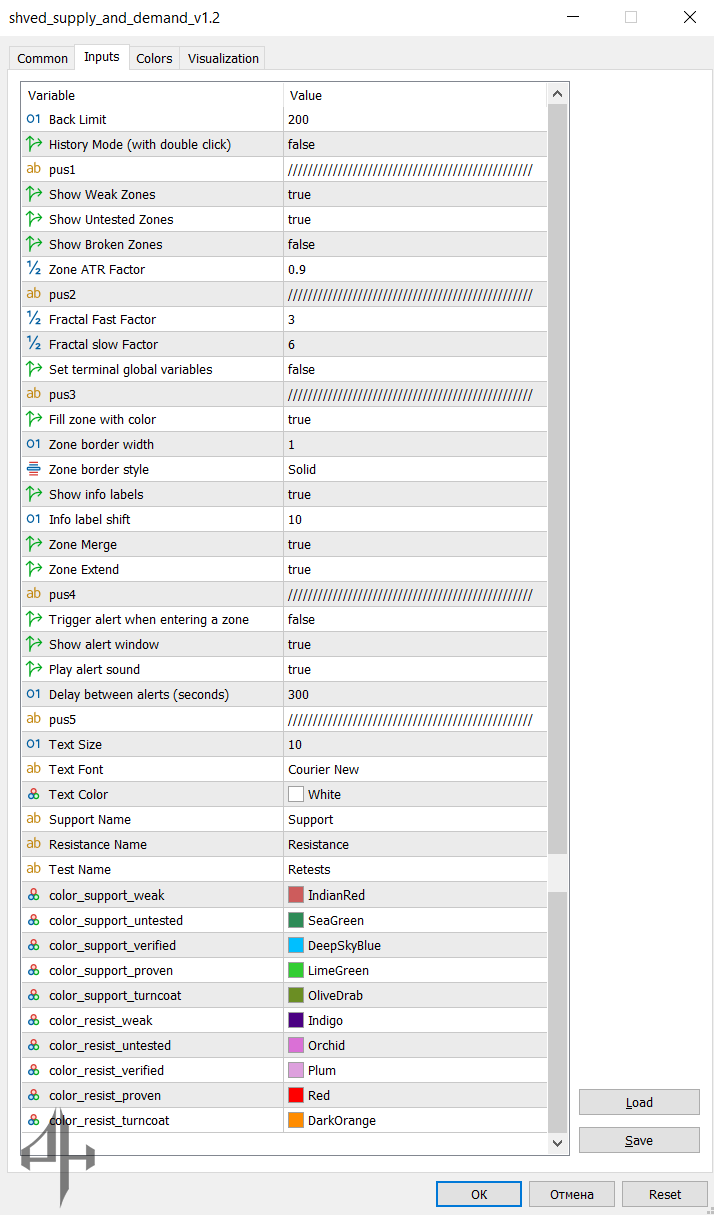
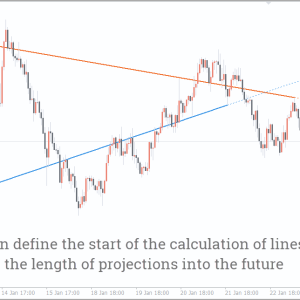
Back Limit: Defines the number of candlesticks used to display the indicator.
Pus 1
- Show Weak Zones: Toggles the display of weak supply and demand zones.
- Show Untested Zones: Enables or disables the display of untested levels.
- Show Turncoat Zones: Allows you to toggle the visibility of “mirror” (turncoat) zones.
- Zone Fuzz Factor: Adjusts the height of supply and demand zones.
Pus 2
- Show Fractals: Enables or disables the display of fractals.
- Fractal Fast Factor: Defines the fast parameter for the fractal search algorithm.
- Fractal Slow Factor: Sets the slow parameter for the fractal search algorithm.
Pus 3
- Zone Solid: Determines the width of the displayed zones.
- Zone Line Width: Adjusts the thickness of the lines defining the price zones.
- Zone Style: Selects the line style for price zones.
- Show Zone Info: Enables or disables the display of text descriptions for the zones.
- Zone Label Shift: Sets the text label offset relative to the price levels.
- Zone Merge: Enables or disables the merging of overlapping zones.
- Zone Extend: Allows combining multiple nearby zones into a single zone.
Pus 4
- Show Zone Alerts: Toggles notifications when the price approaches a zone.
- Zone Alert Popups: Enables or disables pop-up alerts when the price reaches a zone.
- Zone Alert Sounds: Toggles sound notifications when a zone is reached.
- Zone Alert Wait Seconds: Sets the delay time for alert notifications when a zone is reached.
Pus 5
- Text Size: Adjusts the size of the text.
- Text Font: Sets the font used for text.
- Text Color: Chooses the color for the text.
- Support Zone Name: Selects the label for support zones.
- Resistance Zone Name: Selects the label for resistance zones.
- Retested Zone Name: Selects the label for retested levels.
- Color Support Weak: Defines the color for weak support zones.
- Color Support Untested: Sets the color for untested support zones.
- Color Support Verified: Chooses the color for tested (verified) support zones.
- Color Support Proven: Sets the color for proven (repeatedly tested) support zones.
- Color Support Turncoat: Selects the color for “mirror” (turncoat) support zones.
- Color Resistance Weak: Chooses the color for weak resistance zones.
- Color Resistance Untested: Defines the color for untested resistance zones.
- Color Resistance Verified: Sets the color for verified resistance zones.
- Color Resistance Proven: Selects the color for proven (repeatedly tested) resistance zones.
- Color Resistance Turncoat: Sets the color for “mirror” (turncoat) resistance zones.
When the indicator is installed for the first time, it will plot all supply and demand zones present on the chart. Initially, this may seem overwhelming, but once you adjust the settings to your preferences, the use of supply and demand levels will become more intuitive and efficient.
Reviews
There are no reviews yet.