
- Description
- Reviews (0)
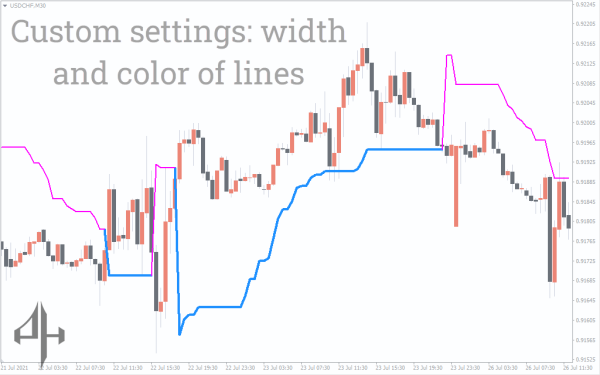
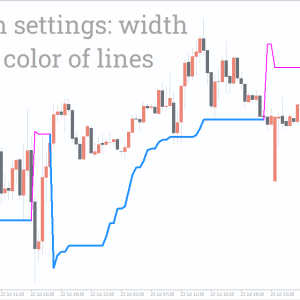
- Indicator Settings
Description
One non-repaint MT4 trend indicator is the Super Trend Indicator. It just uses one trendline curve to display the market trend’s reversal points.
Only when you can accurately predict a trend’s path will it be your buddy in financial trading. Making lucrative entries, however, requires more than just identifying the correct trend. We must evaluate the price’s strength and project the spectrum of potential future market movements.
This updated edition of Super Trend helps you assess the strength and weakness of price movements and provides information about the state of the trend.
How to use Super Trend for trading forex and stocks in MT4
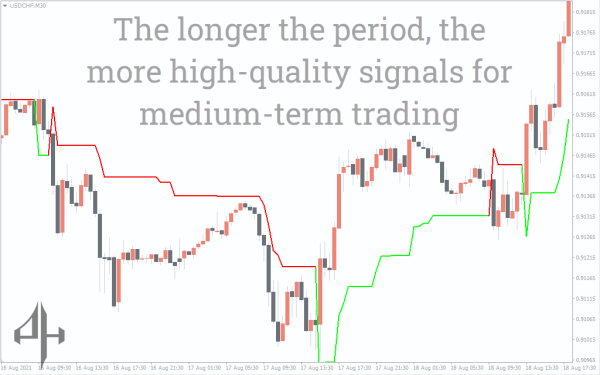
Its Nbr timeframe and multipliers are used to determine the Super Trend Indicator value. Based on the price position in relation to the indicator level, we will ascertain the market tendencies.
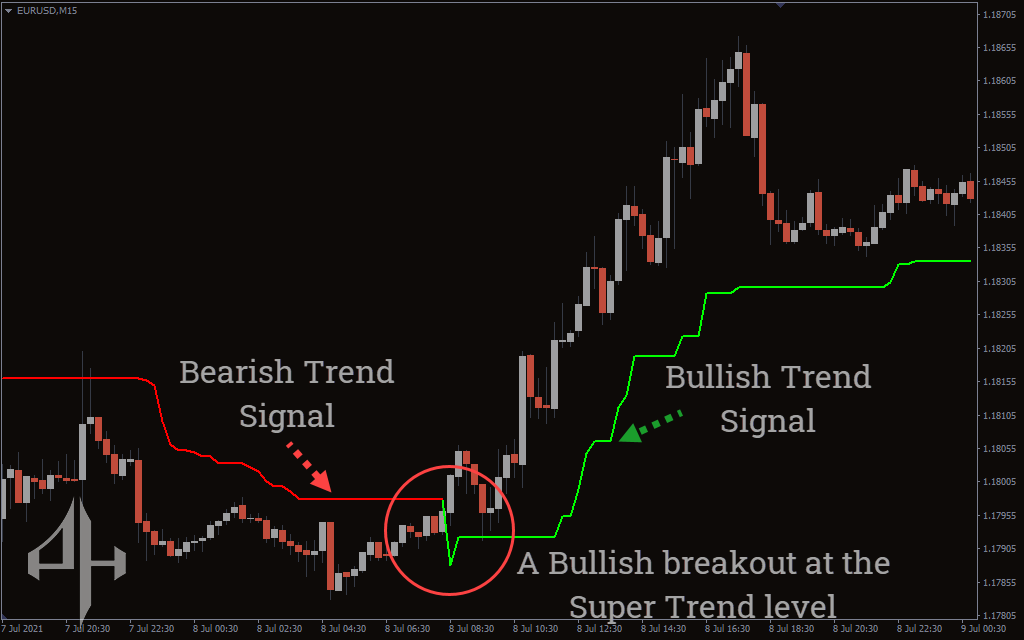
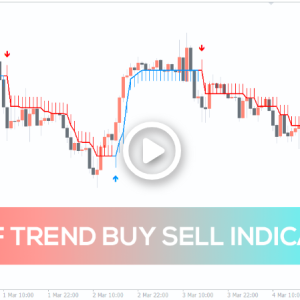
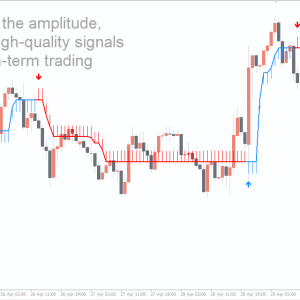
The price is generally going upward when it breaks the super trend line and stays above the indication level. In a market with a bullish trend, the indicator goes green. The indicator level will serve as trendline support in such circumstances. The Super Trend Indicator color changes to red to indicate a negative trend once the price breaches the support line. The super trend level is viewed by the price as a trendline resistance during a bearish run.
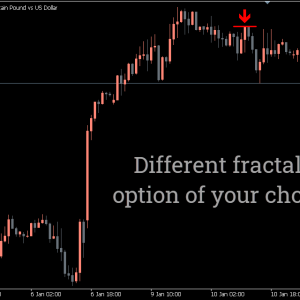
The Super Trend Indicator line in the accompanying chart does not respond to the closing of each price candle, as you can see if you examine it attentively. Occasionally, the indicator level traces a straight horizontal line while being constant. It occurs when the price closes as within bars after failing to break the high or low of its previous candle. Therefore, we refer to the market as sidelined whenever the indicator level stops ticking.
In either case, watch for a significant price breakout when you see a sidelined market. For example, when the price follows the market’s downward trend and produces a bearish breakout, open a sell order. Otherwise, if the price shows a bullish breakout at the super trend resistance level, proceed with a long position.
Additionally, you can utilize the Super Trend Indicator as your trade entry’s initial stop-level as well as its trailing stop-level. When the price breaches the trendline in the opposite direction of where you entered the trade, exit the order.
Conclusion
Moving averages and the Super Trend Indicator function similarly. There are just a few basic trading rules involved, and they are incredibly simple to learn. Therefore, in addition to seasoned traders, novices can also profit from its traditional trend signs. Additionally, it is simple to incorporate into any trend-following trading strategy.
In order to identify intraday trend reversal conditions, this indicator has been specifically parameterized. But when used for day trading, it also provides accurate buy/sell signals, particularly for stock and currency assets.
Be the first to review “Super Trend Indicator”
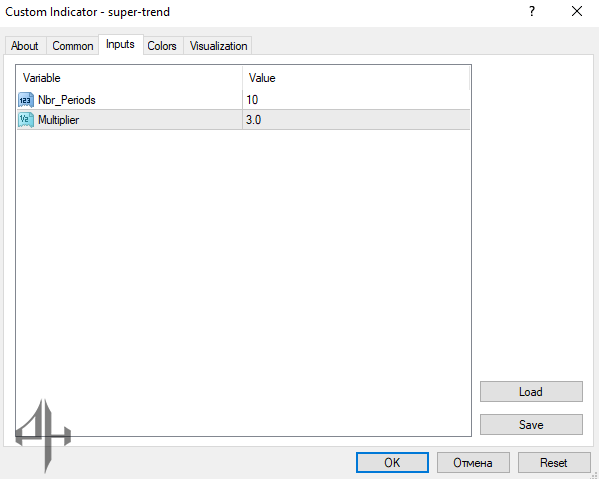
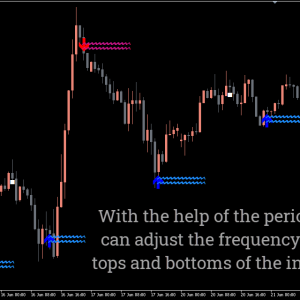
Nbr Periods: This figure indicates how long the indicator’s period is. It establishes how far the indicator will search in order to gather price information. Additionally, the indicator periods have a direct impact on the Super Trend’s signal frequency.
Multiplier: Modify it to change the price’s separation from the super trend line.
Reviews
There are no reviews yet.