

- Description
- Reviews (0)
- Indicator Settings
Description
For intraday forex traders that use the breakout trading method, the Support Resistance Breakout Arrows Indicator for MT4 is crucial. The indicator gives forex traders the best BUY and SELL arrow recommendations by combining Fractal, CCI, and RSI. In addition, traders can use the significant Sup&Res levels that the indicator automatically draws to add extra positions when the trend is strong. The support and resistance lines and the signal arrow are not repainted by this Metatrader 4 indicator.
Support Resistance Breakout Arrows Indicator Trading Signals
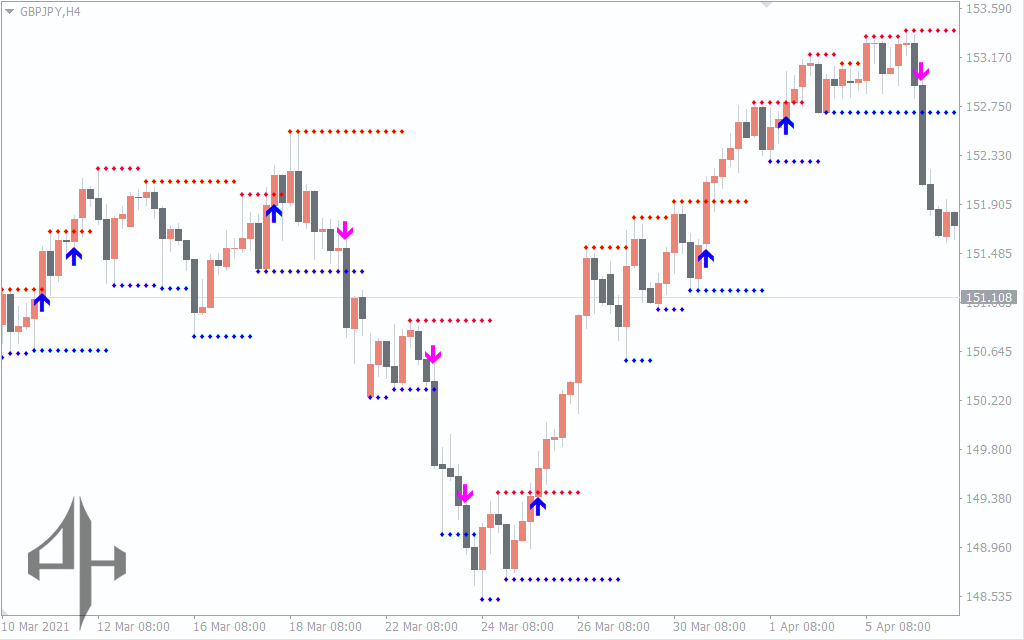
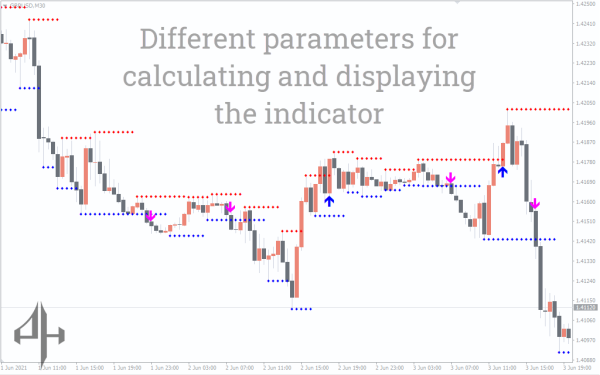
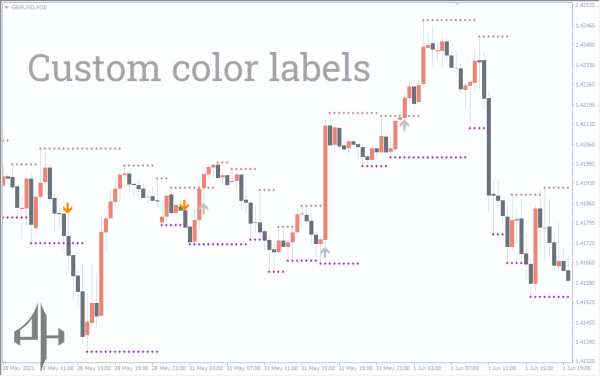
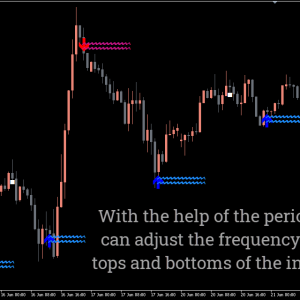
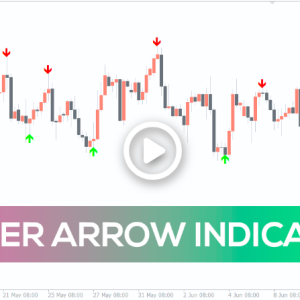
The Support Resistance Breakout Arrows Indicator for Metatrader 4 is displayed in the GBPJPY H4 chart above, along with the Sup&Res levels and trading signal arrows. Blue color arrows indicate buy signals, whereas magenta color arrows indicate sell indications. Additionally, RED indicates the resistance levels and BLUE indicates the support levels.
When the color signal arrow is blue, forex traders can buy. Nevertheless, during a trend, there might be multiple BUY signals. At each indication, traders have the option to BUY, and at the opposite signal, they can quit all holdings. However, as the Majenta color arrows show up, SELL traders can enter positions.
Pivot levels are not the basis of the indicator. Nevertheless, it shows the optimal Sup&Res lines and zones according to RSI, CCI, and fractals. The RSI overbought and oversold levels as well as the CCI levels can be used by traders to filter the signals using the indicator settings.
The automatic detection of the strong Sup&Res levels is a major benefit for novice forex traders. Additionally, the indicator is appropriate for intraday traders and functions across all time frames. Nonetheless, the H4, Daily, and Weekly chart periods are available for trading for long-term traders. Its non-repaint nature is another essential feature. Expert forex traders can add extra positions in the trend direction by using the support and resistance lines. and use multi-time frames (mtf) to handle the signals in intricate trading techniques.
Conclusion
In conclusion, the Support Resistance Breakout Arrows Indicator for MT4 is a crucial instrument for automatically determining the Sup&Res level. Additionally, the trader can stay on the trend by filtering signals using the CCI and RSI. Nonetheless, reliable and lucrative outcomes can be obtained by combining price action with the trade signals and Sup&Res breakouts. Additionally, the indicator may be easily loaded in Metatrader 4 and is available for free download.
Be the first to review “Support Resistance Breakout Arrows Indicator, Support & Resistance Master Tool”
For strong signals, the RSI and CCI filters can be activated. In addition to setting the support and resistance line alerts to sound when the candle closes, traders can also modify them to display powerful indications.
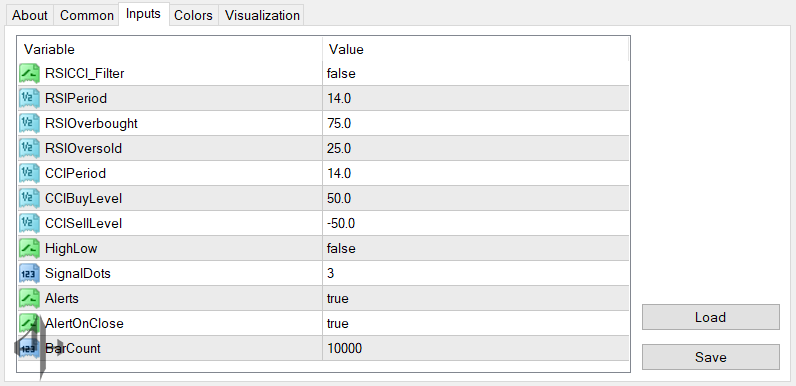
RSICCI_Filter: Applies filtering to the signal using both the RSI and CCI indicators.
RSIPeriod: Defines the time period used for calculating the Relative Strength Index (RSI).
RSIOverbought: Threshold indicating the overbought condition for RSI.
RSIOversold: Threshold indicating the oversold condition for RSI.
CCIPeriod: Time period used to compute the Commodity Channel Index (CCI).
CCIBuyLevel: CCI value that signals a potential buy opportunity.
CCISellLevel: CCI value that signals a potential sell opportunity.
HighLow: Triggers alerts when the price breaks above the high or below the low.
SignalDots: Specifies how many signal dots are required to confirm a signal.
Alerts: Enables or disables alert notifications.
AlertOnClose: Issues alerts only after the candle has closed.
BarCount: Sets how many bars are shown for the indicator on the chart.
Reviews
There are no reviews yet.