

- Description
- Reviews (0)
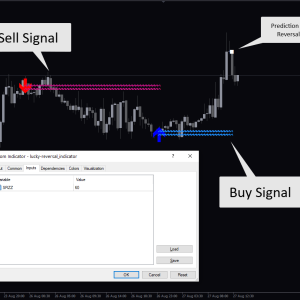
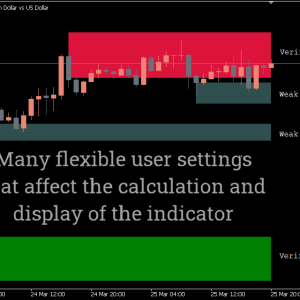
- Indicator Settings
Description
The majority of forex traders frequently ignore trading volume, a crucial indicator in technical analysis. Forex traders view these locations as crucial since higher volume trading is frequently linked to price reversals. Forex traders can use the MT4 volume profile indicator to see low and high volumes as well as the volume point of control, or VPOC.
When trade volumes are at their highest, the VPOC or POC is seen as a significant support or resistance area. The market in the VPOC area is therefore very likely to invert.
Volume Profile Indicator Strategies
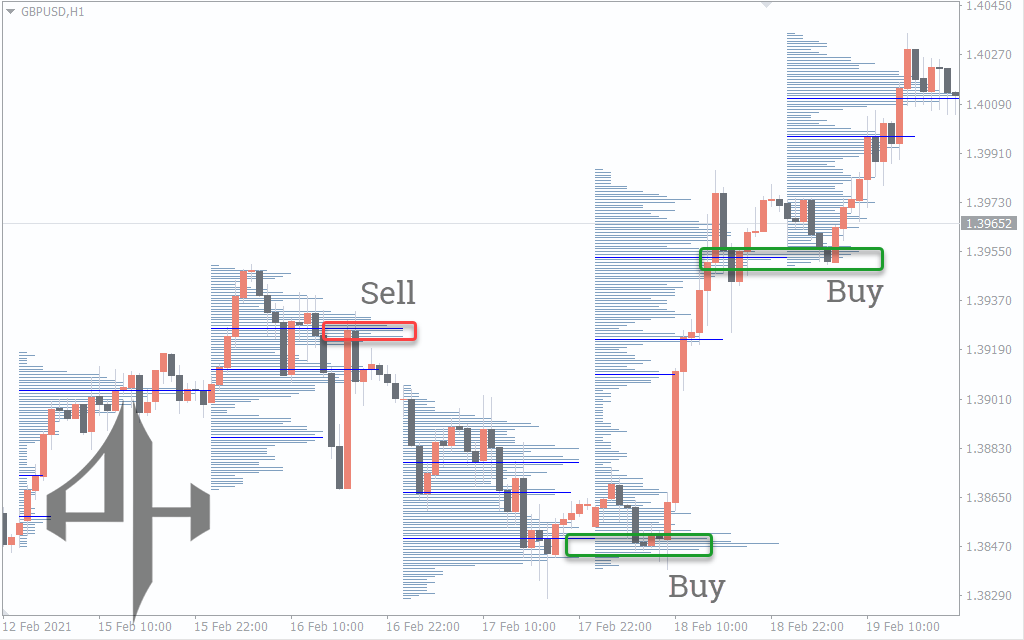
As the indicator showed the volume levels to construct a volume profile, the prices in the GBPUSD H1 chart above reversed in the VPOC and proceeded to move in the trend direction through low volume zones. As a result, it helped the forex trader spot possible reversal zones. Additionally, the volume point of control, also known as VPOC or POC, served as a reversal point and was a great place for support or opposition.
Following their marking, VPOC or POC regions serve as future support and resistance points, which are frequently retested by markets. The retest in these areas thus offers more points of entrance. However, as the VPOC, the volume point of control offers an excellent departure option for booking profits. The high volume area serves as a possible escape point in addition to the VPOC.
To develop a comprehensive market picture, traders frequently combine VPOC with TPO (Time Price Opportunities). All kinds of online forex traders might benefit from the volume profile indicator’s graphic lines and bars. Additionally, the indicator may be used on any chart timeframe and is free to use and download. For the greatest trading outcomes, forex traders should, however, cross-check the indicator indications with price activity.
Indicator Features
Volume Tick. The volume profile indicator creates a horizontal volume profile that displays the distribution of trade activity at various price levels by using tick volume from the shortest timeframe.
adjustable time frame. enables the choice of a precise time frame, from one minute to one month, for creating the volume histogram.
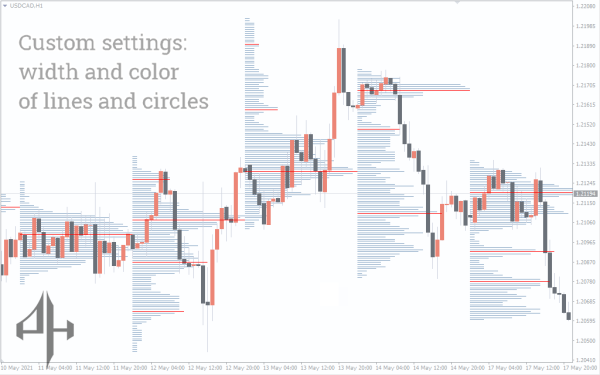
Appearance Options:
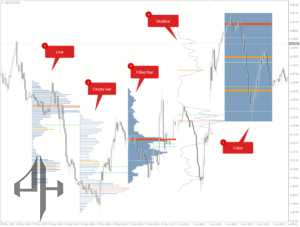
- Lines: Shows the volume profile as lines that are horizontal.
- Empty Bars: Displays blank rectangle bars for the profile.
- Filled Bars: Uses filled rectangle bars to depict the profile.
- Outline: Outlines the shape with a line to draw the profile.
- Color: To show volume measurements at particular levels, solid rectangles with colors are used.
Be the first to review “Volume Profile Indicator, Unlock Hidden Market Zones”
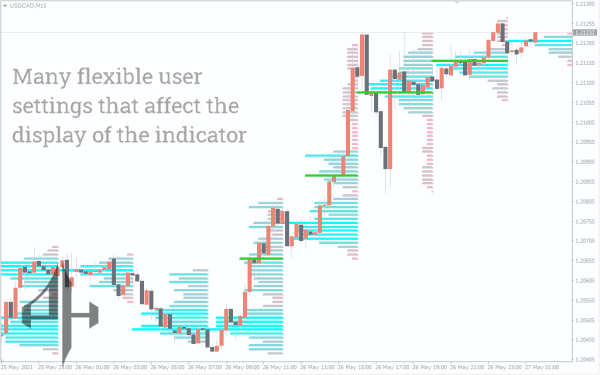
The indicator is incredibly versatile and offers a wide range of settings for all kinds of forex traders.
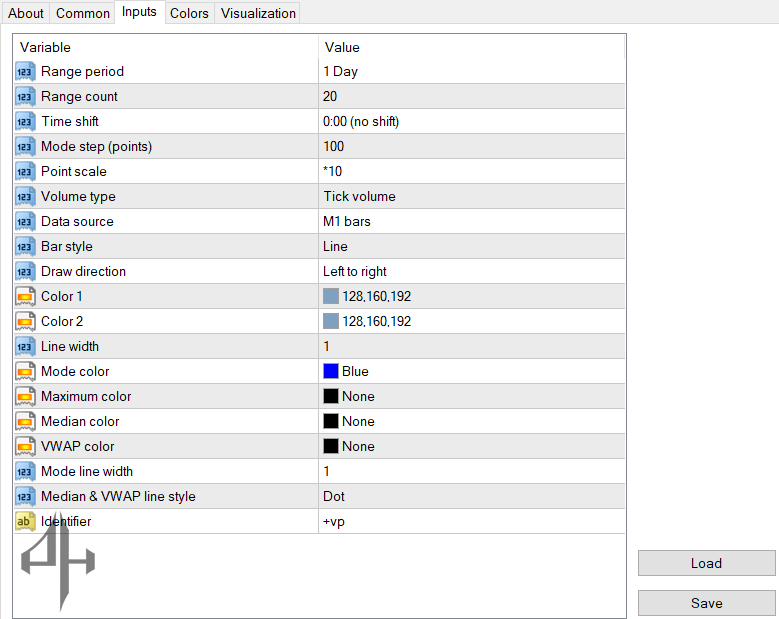
- Range Period: Sets the chart period used to calculate each volume profile. Multiple profiles can appear on a single chart.
- Range Count: Number of volume profiles to display on the chart.
- Timeshift: Moves the volume profile data forward or backward on the chart.
- Mode Step (Points): Step size (in points) used to build the volume profile structure.
- Point Scale: Multiplies the step size to adjust the profile’s granularity.
- Volume Type: Uses MT4’s default Tick Volume or can be switched to Real Volume if supported.
- Data Source: Timeframe used to calculate the volume profile. Lower timeframes offer more detail.
- Bar Style: Sets how the profile bars appear (lines, filled bars, outlines, etc.).
- Draw Direction: Determines if bars are drawn left-to-right or right-to-left.
- Color 1 & Color 2: Define a heatmap gradient. Low volume uses Color 1; high volume shifts toward Color 2.
- Line Width: Sets the thickness of the volume profile bars.
- Mode Color: Color used for the VPOC/POC (Volume Point of Control).
- Maximum Color: Highlights the level with the highest volume.
- Median Color: Color of the median volume level.
- VWAP Color: Color of the VWAP (Volume Weighted Average Price) line.
- Mode Line Width: Thickness of the VPOC/POC line.
- Median and VWAP Line Style: Style for median and VWAP lines (solid, dashed, etc.).
- Identifier: Custom label used to identify or organize profiles on your chart.
Reviews
There are no reviews yet.